
Summary
Every Sunday from September through February, roughly 17 to 19 million Americans tune into any given NFL game – and millions more seek out the recap the moment the final whistle sounds. NFL game recaps have evolved from brief wire-service...
Table of contents
- 1 What Is an NFL Game Recap?
- 2 A Brief History of NFL Game Coverage
- 3 The Anatomy of a Modern NFL Game Recap
- 4 Where to Find NFL Game Recaps: The Major Platforms
- 5 How to Read an NFL Box Score
- 6 Advanced Metrics That Appear in NFL Recaps
- 7 NFL Recaps by Broadcast Window: Thursday, Sunday, and Monday
- 8 Using NFL Game Recaps for Fantasy Football
- 9 NFL Playoff and Super Bowl Game Recaps
- 10 NFL Recap Formats Across Different Media
- 11 Frequently Asked Questions About NFL Game Recaps
- 11.1 Where is the best place to read official NFL game recaps?
- 11.2 How quickly are NFL game recaps published after a game?
- 11.3 What is the difference between a game recap and a box score?
- 11.4 Can I watch full game replays along with the recap?
- 11.5 How do NFL game recaps handle player injuries that occurred during the game?
- 11.6 What do glossy versus analytical NFL recaps mean?
- 11.7 Are NFL game recaps available for older, historical games?
- 11.8 How do I use NFL game recaps to improve my understanding of football strategy?
- 12 Sources
Every Sunday from September through February, roughly 17 to 19 million Americans tune into any given NFL game – and millions more seek out the recap the moment the final whistle sounds. NFL game recaps have evolved from brief wire-service dispatches into rich, multi-layered documents that blend scoring summaries, statistical breakdowns, video highlights, and advanced analytics. Whether you missed the game entirely, want to relive a key fourth-quarter drive, or need hard numbers for your fantasy league, the modern game recap is the starting point for every serious football conversation.
What Is an NFL Game Recap?
An NFL game recap is a written or multimedia record of everything that happened in a single football game after the clock hits zero. At its most basic, it includes the final score, scoring drives, standout individual performances, and a short narrative summary. At its most detailed – think Pro Football Reference or the league’s own Next Gen Stats feed – it includes play-by-play logs, snap counts, expected points added (EPA), and route-running data measured in fractions of a second.
Recaps serve fundamentally different audiences. A casual fan wants a two-paragraph story: who won, who scored, and why. A fantasy manager needs rushing yards, targets, and red-zone touches for every relevant skill player. A coach or scout wants efficiency rates, third-down conversion percentages, and pressure statistics. The best platforms understand these different needs and layer their coverage accordingly.

A Brief History of NFL Game Coverage
The National Football League was founded in 1920 as the American Professional Football Association. In its early decades, game coverage consisted almost entirely of short newspaper dispatches sent over telegraph wires. Reporters filed stories the next morning; statistics were sparse and inconsistently tracked. Completion percentages, rushing yards, and passing touchdowns became standard record-keeping categories only as the league formalized its statistics department through the 1930s and 1940s.
Television changed everything. The first nationally televised NFL Championship Game aired on NBC in 1951, and by the mid-1960s the league had negotiated a groundbreaking national broadcast deal that put games in front of tens of millions of households every weekend. The first Super Bowl, played in January 1967 between the Green Bay Packers and the Kansas City Chiefs, introduced the concept of the must-read game recap: a single contest so significant that every sports editor in the country ran a full-column breakdown the following morning.
The internet era brought a second revolution. Sites like ESPN.com and CBSSports.com began publishing recaps within minutes of the final whistle, racing to be first with video highlights and stat boxes. Pro Football Reference launched in 2000 and became the go-to archive for historical data, giving fans the ability to cross-reference any game going back to the 1920 season. Social media compressed the timeline further: by the late 2010s, real-time recapping was happening play by play, with individual touchdowns and big defensive stops instantly contextualized by thousands of accounts simultaneously.
The Anatomy of a Modern NFL Game Recap
A well-structured recap moves through several distinct layers. Understanding each one helps you extract exactly what you need without wading through irrelevant material.
Scoring Summary. The top of any good recap shows every scoring play in chronological order: the quarter, the time on the clock, the type of play (rushing touchdown, passing TD, field goal, safety, special-teams score), the player credited, and the updated score after that play. This gives you the game’s narrative spine in thirty seconds.
Team Statistics. Just below the scoring summary sits the standard team stat comparison: total yards, passing yards, rushing yards, first downs, time of possession, turnovers, third-down conversion rate, and red-zone efficiency. These numbers tell you whether the final score reflected the actual flow of the game or whether one team won despite being outgained on the stat sheet.
Individual Performance Lines. Quarterbacks get completions/attempts/yards/touchdowns/interceptions plus a passer rating. Running backs receive carries/yards/average/touchdowns and often receiving targets. Wide receivers and tight ends get targets/receptions/yards/touchdowns. Defenders get tackles, sacks, pass deflections, interceptions, and forced fumbles. These lines are what fantasy managers care about most, and they form the basis of any deeper analysis.
Narrative Recap. The written story – usually 300 to 1,000 words in media outlets – adds context the numbers alone cannot supply: the weather conditions, crowd noise that affected a quarterback’s cadence, a key penalty that reversed momentum, or a coaching adjustment in the third quarter that proved decisive. This layer is where skilled reporters separate a game recap from a box score printout.
Advanced Metrics. The most sophisticated recaps now layer in EPA (Expected Points Added), DVOA (Defense-adjusted Value Over Average), QBR (Total Quarterback Rating), and Next Gen Stats like receiver separation and time to throw. These metrics give analysts a statistical picture that traditional box scores simply cannot provide, and their presence in mainstream coverage has grown steadily since the mid-2010s.
Where to Find NFL Game Recaps: The Major Platforms
The range of places to access NFL recaps has expanded dramatically over the past decade. Each platform has a distinct strength depending on what type of recap you need.
NFL.com. The official league site publishes recaps for every game within minutes of the final whistle. The format is clean and authoritative: scoring summary, team stats, individual leaders, a short written overview, and embedded video highlights from NFL Films. Box score data here is considered the official record and is verified by the Elias Sports Bureau, the NFL’s official statistician.
ESPN. ESPN’s game recap pages pair the standard statistical breakdown with a longer narrative story from beat reporters, plus the proprietary QBR metric. ESPN archives every game and makes historical recaps searchable, which is useful for researching a team’s performance across multiple seasons.
Pro Football Reference (Sports Reference). The gold standard for statistical depth. Every game since 1920 is catalogued with full box scores, snap counts, advanced splits, and weather data. The site is indispensable for historical research and for cross-referencing a current performance against a player’s career norms.
NFL Network. The league’s cable channel runs “NFL GameDay Final” and extended highlight packages that cover every game in video form, often including sideline reports and coach audio. For fans who want a visual recap rather than a text one, NFL Network’s postgame programming is the primary destination.
Amazon Prime Video. Since 2022, Amazon has held exclusive streaming rights to Thursday Night Football. Its recap pages integrate with the main TNF broadcast content and offer an X-Ray-style stat overlay that persists as a searchable record after the game ends.
The Athletic. Known for long-form, reporter-driven recaps, writers at The Athletic bring film-room analysis to their postgame coverage, making it the top destination when you want to understand why a play worked rather than simply what happened.
| Platform | Recap Type | Best For | Historical Depth |
|---|---|---|---|
| NFL.com | Official box score + short narrative | Quick, authoritative score check | Back to 1970 (merger era) |
| ESPN | Stats + reporter narrative + QBR | Casual fans, QBR followers | Full digital archive |
| Pro Football Reference | Deep box score + advanced splits | Research, fantasy, historical | Back to 1920 |
| The Athletic | Long-form narrative + film analysis | Tactical depth, beat coverage | Limited |
| Amazon Prime Video | Video + X-Ray stat overlay | Thursday Night Football only | TNF from 2022 onward |
| NFL Network | Video highlights + studio show | Highlight-first viewers | NFL Films archive |
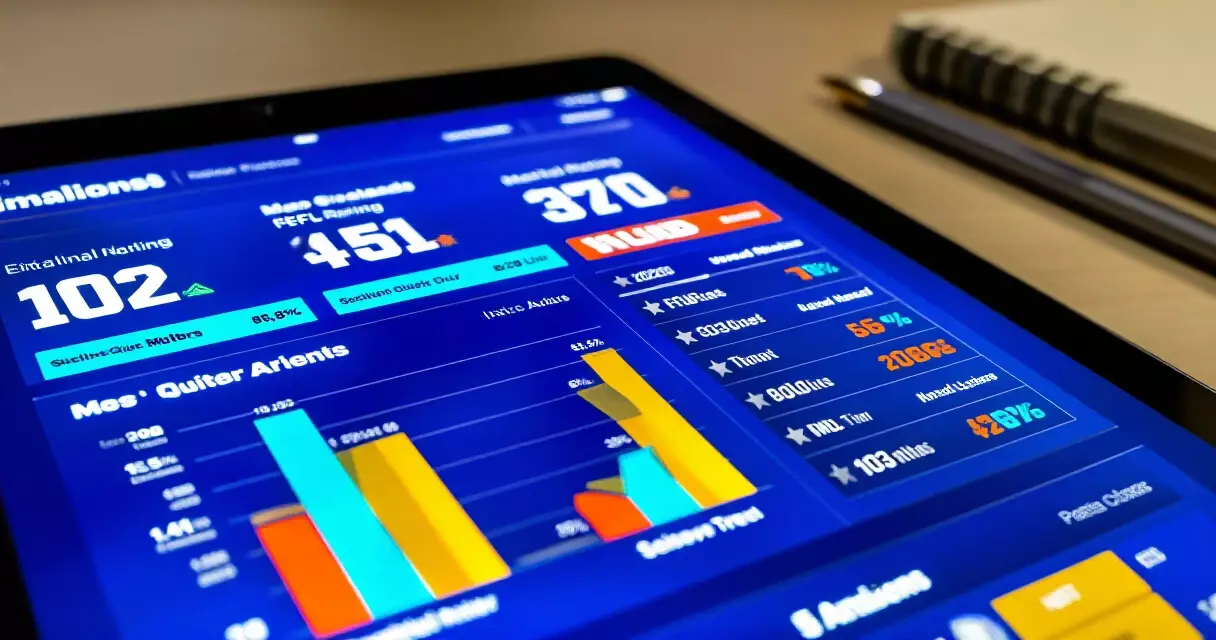
A final score tells you who won. A full game recap tells you whether the outcome was inevitable, lucky, or something the losing team should study hard before next week.
How to Read an NFL Box Score
The box score is the shorthand language of football. Reading one fluently separates a casual sports fan from an informed one. Here is a breakdown of each major section.
Quarter-by-Quarter Scoring. The top line of any box score shows points scored in each quarter (Q1, Q2, Q3, Q4) and the final total. Overtime periods are listed separately. A team that scores 17 points in the first half and only three in the second looks very different in context than the final 20–17 scoreline alone suggests.
Passing Statistics. The passer rating – a formula combining completion percentage, yards per attempt, touchdown rate, and interception rate, scaled to a 0–158.3 range – is the most condensed single-number summary of a quarterback’s game. A rating above 100 is generally strong; below 70 signals a difficult afternoon. ESPN’s QBR metric adjusts for context like garbage-time situations and opponent quality, which makes it a stronger predictor of future performance than the traditional passer rating.
Rushing Statistics. Yards per carry (YPC) is more revealing than total rushing yards when one back has far more attempts than another. A running back who posts 22 carries for 88 yards (4.0 YPC) had a steady game; 8 carries for 88 yards (11.0 YPC) included at least one breakaway run that may not be repeatable against a different defense.
Receiving Statistics. Targets – the number of times a quarterback threw toward a receiver – are often more valuable than receptions for analytical purposes. A receiver with 10 targets, 6 catches, and 58 yards on a losing team was more involved in the offense than one with 3 catches for 72 yards generated on a trick play.
Defensive Statistics. Solo tackles, assisted tackles, sacks, quarterback hits, tackles for loss, pass deflections, interceptions, and fumble recoveries are the standard categories. Sacks and interceptions have the biggest immediate impact on game flow; tackles-for-loss indicate a defensive front that penetrated the backfield consistently throughout the game.
Advanced Metrics That Appear in NFL Recaps
Modern NFL recaps increasingly include advanced statistics that require a bit more context to interpret correctly. These are the ones you will encounter most often across the major platforms.
Expected Points Added (EPA). EPA calculates how much each play increased or decreased a team’s expected point total based on down, distance, and field position. A short third-down gain that picks up the first down is worth more EPA than a 10-yard gain on first-and-10 from your own 20. Positive team EPA per play typically separates winning teams from losing ones more reliably than raw yardage totals.
DVOA (Defense-adjusted Value Over Average). Developed by Football Outsiders, DVOA adjusts every play for the quality of the opponent faced. A 400-yard passing game against the league’s worst secondary means less than a 280-yard performance against an elite defense. DVOA is expressed as a percentage above or below league average; a team with +20% offensive DVOA is performing 20 percent better than a league-average offense against the defenses it has actually faced.
Next Gen Stats. The NFL partnered with AWS to install tracking chips in player shoulder pads and every game ball, generating positional data 25 times per second. This feeds metrics like average separation at time of catch for receivers, time to throw for quarterbacks, and rushing yards over expectation for running backs. These metrics appear in official NFL recaps, are embedded in broadcast graphics, and are available for free at NextGenStats.NFL.com.
Air Yards and Yards After Catch (YAC). Air yards measure how far a pass traveled beyond the line of scrimmage before it was caught. YAC measures how many additional yards the receiver gained after securing the ball. A quarterback with high air yards per attempt is throwing deep; one with low air yards heavily relies on his receivers to generate yards after the catch, which shifts credit toward skill-position athleticism rather than quarterback decision-making.
| Metric | What It Measures | Where to Find It | Key Threshold |
|---|---|---|---|
| Passer Rating | QB efficiency (composite formula, 0–158.3 scale) | Any box score | 100+ = strong game |
| QBR | QB value adjusted for context and game situation | ESPN | 60+ = above average |
| EPA per Play | Play-level expected point impact | Pro Football Reference, ESPN | +0.1 or higher = efficient |
| DVOA | Opponent-adjusted performance vs. league average | Football Outsiders | +10% = clearly above average |
| Avg. Separation | Space a receiver created at catch point | NFL Next Gen Stats | 3.0+ yards = open look |
| Time to Throw | Seconds from snap to quarterback release | NFL Next Gen Stats | 2.5s+ = slow; 2.2s = quick |
| YAC | Yards gained after the catch is secured | Pro Football Reference, ESPN | Varies by route type |
| Air Yards | Depth of target past the line of scrimmage | Pro Football Reference | 10+ avg = downfield passer |

NFL Recaps by Broadcast Window: Thursday, Sunday, and Monday
The NFL spreads its games across several broadcast windows each week, and the recap ecosystem differs slightly for each one.
Thursday Night Football. Amazon Prime Video holds exclusive streaming rights to TNF through 2033 under a deal worth approximately $1 billion per year. Recaps for Thursday games appear on Prime Video’s TNF page, NFL.com, and all major sports outlets. Because Thursday games kick off just four days after Sunday, postgame narratives often focus on short-week preparation and injury management as factors in the outcome.
Sunday Afternoon Windows. CBS and Fox split the Sunday afternoon slate, with CBS traditionally broadcasting AFC matchups and Fox covering the NFC. These two windows typically account for 12–14 games per week. RedZone – available via NFL Network or various cable providers – functions as a real-time curated recap feed, cutting to every scoring play across all simultaneous games.
Sunday Night Football. NBC’s Sunday night package is the most-watched prime-time program on American television. Sunday Night Football has finished as the top-rated show in U.S. prime time for over a decade, according to NBC Universal annual audience reports. Recaps for SNF games receive amplified coverage partly because the game serves as a week-closing showcase matchup selected specifically for its broad national appeal.
Monday Night Football. ESPN and ABC share the Monday night package. MNF carries the longest single-broadcast tradition of any NFL property, dating to 1970. Because Monday Night games air a full day after the Sunday slate, the narrative framing typically incorporates context from Sunday’s results that affected playoff standings or divisional races.
In 2023, NFL games occupied 93 of the 100 most-watched television programs in the United States, according to Nielsen – a concentration of audience that no other sport, event, or entertainment property comes close to matching.
Using NFL Game Recaps for Fantasy Football
Fantasy football is a multi-billion-dollar industry in the United States, with the Fantasy Sports & Gaming Association estimating that more than 40 million Americans participated during the 2024 season. Game recaps are the primary raw material fantasy managers use to evaluate their rosters, make waiver-wire decisions, and assess trade value.
The most critical numbers for fantasy purposes are not always the headline stats. A running back’s target share in the passing game, a tight end’s snap count, and a receiver’s air yards per target all signal opportunity more reliably than single-game point totals. Serious fantasy managers cross-reference the official box score with snap count data – available on Pro Football Reference within 24 hours – to understand whether a big performance reflected a permanently elevated role or a one-week anomaly driven by an opponent injury.
Platforms like FantasyPros, Sleeper, and RotoWire have built entire products around turning game recaps into fantasy-relevant summaries. Sleeper delivers push notifications tied to game-changing plays as they happen; RotoWire posts structured postgame reports with explicit fantasy implications flagged for each relevant player. For a parallel look at how summary data works on the baseball side, see our piece on MLB game summaries for fantasy baseball and betting.
Injury reports that emerge from postgame press conferences are also a critical component of recap coverage. When a star running back is listed as questionable on the Wednesday injury report, the context from the prior Sunday’s recap – snap percentage, whether play-calling shifted away from him late in the game, video evidence of movement quality – provides the earliest reliable signal about his probable status for the following week.
NFL Playoff and Super Bowl Game Recaps
Playoff game recaps operate at a different level of intensity and depth than regular-season ones. Each postseason game eliminates one team from contention, so the stakes compress the narrative: every decision, every turnover, and every fourth-down call gets examined in granular detail.
The postseason structure – Wild Card Weekend, Divisional Round, Conference Championship Weekend, and the Super Bowl – provides a natural hierarchy of recap importance. Wild Card recaps establish early narratives. Divisional round recaps are often the most analytically rich, as they typically feature the highest-quality matchups. Conference Championship recaps set the Super Bowl stage and generate the most anticipatory secondary commentary.
Super Bowl recaps stand in a category of their own. The game routinely draws audiences that would be extraordinary by any other sport’s standards: Super Bowl LVIII in February 2024 peaked at 123.7 million viewers on CBS and Paramount+, making it the most-watched program in U.S. television history at that point. Recap content for the Super Bowl continues to be produced and consumed for days after the game, with deep-dive film breakdowns, quarterback analysis, and coaching-decision retrospectives extending the post-game conversation far beyond any regular-season contest.
NFL Films plays a unique role in playoff recap content. The league-owned production company has documented every Super Bowl since Super Bowl I in January 1967, creating a permanent visual archive. Its “America’s Game” and “NFL Films Presents” series turn single-game recaps into full documentary treatments that continue to be watched years after the outcomes are known.
For a parallel look at how baseball structures its own post-game storytelling, our article on the anatomy of an MLB game inning by inning provides a useful comparison of how different sports organize their recap formats.
NFL Recap Formats Across Different Media
The same game gets recapped in radically different formats depending on the platform and audience. Understanding those differences helps you choose the right source for the level of detail you need.
Wire-Service Recaps. The Associated Press produces a standard game recap within 15–20 minutes of every NFL game ending. These pieces – typically 400–600 words – follow a rigid inverted-pyramid structure: score and winning team lead, followed by key statistical performances, a significant turning point, and a brief quote from each head coach. AP recaps appear on hundreds of newspaper sites and news aggregators, prioritizing speed and neutrality over depth.
Broadcast Network Digital Recaps. CBS Sports, NBC Sports, Fox Sports, and ESPN publish medium-length recaps (600–1,200 words) that combine the AP-style summary with proprietary statistics and embedded video highlights. The video component is significant – watching a touchdown catch or a strip-sack in actual footage adds context no text description can fully replicate. These are the recaps most casual fans encounter through Google search results or Apple News.
Podcast and Audio Recaps. Short-form audio recap shows – like ESPN’s “NFL Recap” podcast and team-specific shows – are designed for consumption during a commute the morning after a game. They typically run 10–20 minutes and prioritize three or four key storylines over a thorough statistical accounting. Audio format favors narrative arc over data density, which suits listeners who absorbed the box score the night before.
YouTube and Social Video. The NFL’s official YouTube channel posts condensed game highlights packages of 10–15 minutes within hours of each game ending. The NFL also licenses short clips to social platforms, where individual touchdowns and big plays become standalone shareable pieces that function as micro-recaps for users scrolling without context.
For those interested in how real-time data APIs serve sports recaps across different properties, our Premier League results data API guide explains how live-feed architectures work on the soccer side of sports publishing.
For international fans navigating streaming access to sports content in the United States, our piece on how to watch Premier League results live in the U.S. covers streaming options that parallel the NFL’s own multi-platform distribution model.
Frequently Asked Questions About NFL Game Recaps
Where is the best place to read official NFL game recaps?
The official source is NFL.com, which publishes a game recap for every regular-season and postseason contest within minutes of the final whistle. These recaps carry statistics ratified by the Elias Sports Bureau, which serves as the NFL’s official statistician. For broader narrative coverage, ESPN and The Athletic are the leading destinations. For pure statistical depth – snap counts, advanced splits, and historical comparisons – Pro Football Reference at pro-football-reference.com is the most thorough publicly available resource and is updated within 24 hours of each game. Each platform has a distinct advantage, so many fans check two or three sources routinely depending on what they want to know and why they want to know it.
How quickly are NFL game recaps published after a game?
Wire-service recaps from the Associated Press typically appear within 15–20 minutes of the final whistle. Official box scores on NFL.com are usually live by the time the postgame handshake line ends. Broadcast network recaps with embedded video go up within 30–45 minutes. Longer analytical pieces from outlets like The Athletic or Football Outsiders may take one to three hours, as writers incorporate film review and broader context. Advanced metrics like snap counts and DVOA adjustments take longer still: snap counts generally appear on Pro Football Reference within 24 hours, and DVOA updates are typically posted by Football Outsiders on the Tuesday or Wednesday following each game week.
What is the difference between a game recap and a box score?
A box score is the raw statistical record of a game: numbers organized into categories without narrative context. A game recap uses those numbers as a foundation and builds a story around them, explaining what the numbers mean, why they turned out that way, and what they suggest about each team going forward. Box scores answer the question “what happened numerically?” Recaps answer “what happened and why?” For most fans, the box score is a reference tool – something you scan while reading the recap to verify a claim or locate a specific performance. Quality recaps from experienced reporters treat the box score as a starting point for inquiry, not an endpoint of understanding.
Can I watch full game replays along with the recap?
Yes, with certain platform requirements. NFL+ Premium – the league’s subscription streaming service – provides full-game replays for every NFL contest, accessible on-demand typically a few hours after the broadcast ends. Subscribers can watch commercial-free replays with all-22 camera angles, which show every player’s route and assignment on every snap – an invaluable companion to any analytical recap. NFL Network also airs condensed game replays. Amazon Prime Video members have access to Thursday Night Football replays. For non-subscribers, official highlight packages on the NFL’s YouTube channel cover the most significant plays without the full game feed and are free to access.
How do NFL game recaps handle player injuries that occurred during the game?
Injury information in recaps is typically sourced from two places: the in-game injury report that officials update on the sideline during play, and the postgame press conference where head coaches provide initial assessments. Recaps will note when a player left the game and did not return, and whether the team characterized the injury as significant. Official injury designations – the “questionable,” “doubtful,” or “out” labels that fantasy managers rely on – only appear on the official injury report released Wednesday through Friday of the following week. Recaps can flag that a player was hurt; they generally cannot confirm severity or recovery timeline immediately after the game.
What do glossy versus analytical NFL recaps mean?
In sports media, “glossy” recaps describe the feel-good, narrative-first, highlight-driven coverage found on league-owned platforms and major broadcast sites. They emphasize memorable moments, star performances, and storylines that resonate with the broadest possible audience. “Analytical” recaps – the kind published by Football Outsiders, The Ringer, The Athletic, and advanced-stats writers – prioritize efficiency metrics, expected value, and opponent-adjusted context over storytelling. Neither type is strictly better; they serve different purposes. Most serious fans benefit from reading both because they answer different questions about the same game from different angles, and together they produce a more accurate picture than either alone.
Are NFL game recaps available for older, historical games?
Yes, to varying degrees of completeness. Pro Football Reference maintains box scores for every NFL game since 1920, making it possible to look up the statistical record of any game in league history. Written narrative recaps from newspapers have been digitized going back decades through archives like ProQuest and Newspapers.com, though access often requires a library card or subscription. NFL Films has documentary-style video coverage of every Super Bowl and many notable regular-season games going back to the 1960s. For the pre-television era, newspaper archives remain the primary source, and the quality and completeness of that coverage vary significantly by market and decade.
How do I use NFL game recaps to improve my understanding of football strategy?
The most effective approach is to read a standard recap first for the narrative, then pull up the play-by-play log on Pro Football Reference and correlate specific plays with what the recap described. Pay attention to down-and-distance tendencies: how often did a team run versus pass on first down? How did their third-down conversion rate compare to their season average? Then, if you want the film-room layer, find the all-22 replay on NFL+ and watch the referenced plays with full field visibility. Long-form analytical writers at The Athletic and Football Outsiders regularly walk readers through this multi-step process, and their methodology columns are an excellent guide for developing your own systematic approach to post-game data and film study.
Sources
- NFL.com – Official game recaps and box scores: https://www.nfl.com/scores/
- Pro Football Reference – Historical box scores and advanced statistics since 1920: https://www.pro-football-reference.com/
- Nielsen – NFL viewership ratings and Year in Sports Media reports: https://www.nielsen.com/insights/
- Wikipedia – National Football League: https://en.wikipedia.org/wiki/National_Football_League
- Wikipedia – Super Bowl LVIII viewership data: https://en.wikipedia.org/wiki/Super_Bowl_LVIII
- Football Outsiders – DVOA methodology and weekly rankings: https://www.footballoutsiders.com/
- NFL Next Gen Stats (AWS partnership) – Player tracking metrics: https://nextgenstats.nfl.com/
Cricket Match Scorecards: Test, ODI & T20 Results Database