

Summary
When Paris Saint-Germain beat Inter Milan 5-0 in the 2024-25 Champions League final, the scoreline told only part of the story. According to BBC Sport, it was the largest winning margin in the history of a European Cup or Champions...
Table of contents
- 1 Where Champions League match stats actually come from
- 2 The core stats every match report shows
- 3 Advanced metrics: how to read xG and beyond
- 4 How match data tracking has evolved
- 5 Comparing the best places to find the data
- 6 How to read a match stat line step by step
- 7 Common mistakes when reading match stats
- 8 Frequently asked questions
- 8.1 Where can I find official Champions League match stats for free?
- 8.2 What does xG mean in a Champions League match?
- 8.3 Why do two websites show different stats for the same game?
- 8.4 How many matches does each club play in the new league phase?
- 8.5 Which stats best predict match outcomes?
- 8.6 Are advanced football stats reliable enough to trust?
- 9 Sources
When Paris Saint-Germain beat Inter Milan 5-0 in the 2024-25 Champions League final, the scoreline told only part of the story. According to BBC Sport, it was the largest winning margin in the history of a European Cup or Champions League final, yet the underlying numbers, shots, possession, expected goals and pressing data, explained why the result was so lopsided long before the final whistle. Champions League match stats are now everywhere, but knowing where to find reliable data and how to interpret it is a different skill from simply reading a final score.
Where Champions League match stats actually come from
Almost every number you see on a broadcast graphic or a stats website traces back to a small set of data collectors. UEFA, the competition’s governing body, publishes official match statistics on UEFA.com for every fixture, including goals, assists, shots, distance covered and disciplinary records. Commercial data firms then add depth: event-level tracking that logs the location and outcome of every pass, tackle and shot.
The dominant supplier is Opta, owned by Stats Perform, whose feeds power many newspaper graphics and television overlays. Free public sites repackage similar data for fans. FBref, part of the Sports Reference family, publishes detailed match pages built on event data, while WhoScored and Sofascore present live in-match dashboards. For results, standings and historical context, the relevant Wikipedia season pages are maintained and sourced to official records.
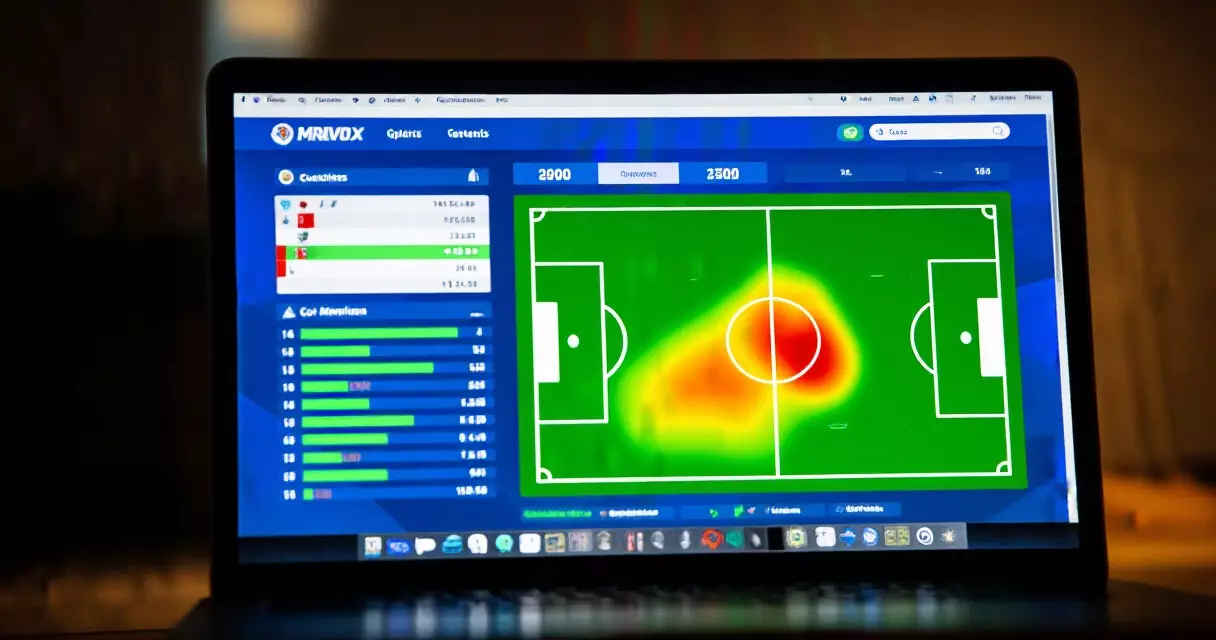
The format change matters here. The old group stage gave each of 32 clubs six matches, but the league phase introduced for 2024-25 expanded the field to 36 clubs playing eight matches each. That produced 144 league-phase fixtures, a much larger pool of public match data than before, as detailed in our breakdown of the league phase versus the old group stage.
The core stats every match report shows
Before reaching for advanced metrics, it helps to be fluent in the traditional counting stats that appear on every official match centre. These figures are easy to find and surprisingly easy to misread when stripped of context. Possession near 70 percent, for example, can signal control or it can signal a team passing harmlessly in front of a deep defensive block.
| Stat | What it measures | How to read it |
|---|---|---|
| Shots / shots on target | Attempts and those forcing a save or goal | Volume hints at pressure, but says nothing about chance quality |
| Possession % | Share of time in control of the ball | High possession without shots often means sterile control |
| Pass accuracy | Completed passes as a share of attempts | Inflated by safe sideways passing; check final-third passes too |
| Corners | Set pieces won from defensive deflections | A weak proxy for territory, not a scoring predictor |
| Fouls / cards | Disciplinary record | Useful for tactical fouling and game-state context |
Counting stats answer the question of what happened. They struggle with the harder question of how dangerous a team really was. A side can register 20 shots from distance and lose to an opponent that took four close-range chances. That gap between volume and quality is exactly what the next generation of metrics was built to close.
Advanced metrics: how to read xG and beyond
Expected goals, written as xG, is the single most important modern match stat. It assigns every shot a value between 0 and 1 based on how often similar attempts have historically been scored, factoring in distance, angle, body part and the type of assist. A tap-in might be worth 0.7 xG, while a speculative 30-yard strike might be worth 0.02. Add up a team’s shots and you get its xG total for the match, an estimate of how many goals an average team would have scored from those chances.
Expected goals turned the eternal argument about who deserved to win into a number you can actually check.
The metric reached mainstream football coverage in the late 2010s and is now shown on UEFA broadcasts and explained by outlets such as The Guardian. Read it as a sense check on the scoreline. If a team wins 1-0 but loses the xG battle 0.4 to 2.1, the result probably flattered them, and regression toward their true level is likely over a run of matches.
Other useful advanced numbers include xA (expected assists), progressive passes and carries, pressures, and PPDA, which stands for passes allowed per defensive action and measures pressing intensity. None of these replace watching the game. They simply give structure to what your eyes suspect. Fans who follow baseball will recognise the same philosophy behind advanced stats such as WPA and use, which also reward chance quality over raw volume.
How match data tracking has evolved
European Cup statistics were once limited to goals, attendance and the bare result, recorded by hand and printed in newspapers. The competition rebranded as the UEFA Champions League in 1992, and televised coverage gradually added on-screen possession and shot graphics through the 1990s. The real shift came with computerised event logging in the 2000s, when firms began tagging thousands of touches per match.
Optical and GPS tracking followed, capturing player positions many times per second and enabling distance-covered, sprint and heat-map data. By the 2020s, semi-automated systems were also feeding officiating tools, and according to Reuters, UEFA adopted semi-automated offside technology in the Champions League from the 2024-25 season, the same campaign that introduced the expanded league phase. The result is that an ordinary fan today has access to richer match data than professional analysts had two decades ago.
Comparing the best places to find the data
No single site does everything well. Official sources are authoritative but shallow on advanced metrics, while analytics platforms go deep but sometimes differ slightly because they use different data suppliers. The table below maps the main free options.
| Source | Type | Best for | Cost |
|---|---|---|---|
| UEFA.com | Official | Verified results, lineups, basic match stats | Free |
| FBref | Analytics | Deep event data, xG, historical tables | Free |
| WhoScored | Analytics | Live in-match dashboards and ratings | Free |
| Sofascore | Analytics | Mobile live stats and heat maps | Free / premium |
| Wikipedia | Reference | Season summaries, records, standings | Free |
A practical workflow is to confirm the result and lineup on UEFA.com, then open FBref for the full statistical breakdown. If you want to track numbers as the match unfolds, WhoScored or Sofascore update live. For long-term context, such as a club’s record across multiple campaigns, the season pages on Wikipedia gather official data in one place. The same source-checking habit applies to following the full Champions League results and standings across a season.
How to read a match stat line step by step
Reading a stat sheet well is a sequence, not a glance. Start with the result and the xG, then drill down only as far as you need.
- Check the scoreline against the xG totals to see whether the result matched the run of play.
- Look at shots on target versus total shots to judge chance quality, not just volume.
- Scan possession alongside final-third entries to tell control apart from sterile passing.
- Read individual xG and xA to find who actually created and finished the chances.
- Use pressing and duel data to understand the tactical story behind the numbers.
A single match is a small sample, so treat one impressive stat line as a clue rather than proof.
This is also where stats meet forecasting. Analysts who build data-driven match predictions lean heavily on rolling xG over many games rather than one eye-catching result, because short samples are noisy. Knowing the match format and rules also helps you read context, since a team chasing a knockout-playoff place reads its own numbers differently from one already through.
Common mistakes when reading match stats
The most frequent error is treating one match as a verdict. Football is low-scoring and variance-heavy, so a 0.4 xG team can win and a 2.5 xG team can lose on any given night. Stats earn their value over a run of fixtures. A second mistake is confusing possession with dominance, when the two often diverge against deep-defending opponents.
Game state distorts almost everything. A side leading 2-0 will happily cede possession and territory, inflating the trailing team’s numbers without ever being in danger. Penalties also skew xG, since a single spot kick is worth around 0.79 xG on its own. Strip out penalties when comparing open-play creation. Finally, never blend numbers from two providers in the same comparison, because their underlying models differ. These habits matter just as much in two-leg ties, where aggregate context shapes how to read each knockout-stage match.
Frequently asked questions
Where can I find official Champions League match stats for free?
UEFA publishes free official match statistics for every fixture on UEFA.com, including goals, assists, shots, possession, distance covered and disciplinary data. For deeper analytics such as expected goals and progressive passes, free platforms like FBref and WhoScored repackage event data into detailed match pages. Wikipedia season articles collect verified results, standings and records in one place. A reliable routine is to confirm the basic facts on UEFA.com, then move to FBref for the advanced breakdown. All of these sources are free, although some analytics sites also sell premium tiers with extra historical depth and faster live updates.
What does xG mean in a Champions League match?
Expected goals, abbreviated xG, estimates the quality of the chances a team created in a match. Every shot is scored between 0 and 1 based on how often similar attempts have historically been converted, accounting for distance, angle, body part and assist type. Summing a team’s shots gives its match xG, which approximates how many goals an average side would have scored from those opportunities. If a team wins by a single goal but loses the xG count heavily, the result likely flattered it. Read xG as a sense check on the scoreline rather than a prediction of any single match.
Why do two websites show different stats for the same game?
Different sites buy data from different suppliers, and each provider uses its own definitions and models. One firm may count a deflected effort as a shot while another does not, and xG models are trained on different historical datasets, so they assign different values to the same chance. Live figures can also lag or get corrected after a match is reviewed. None of this means a site is wrong. It simply means you should treat advanced numbers as a range and avoid mixing figures from two providers inside the same comparison. For settled facts like the final score, always defer to the official UEFA record.
How many matches does each club play in the new league phase?
Since the 2024-25 season, each of the 36 clubs plays eight league-phase matches against eight different opponents, four at home and four away, rather than the six group-stage games used under the old 32-team format. That produces 144 league-phase fixtures in total before the knockout rounds begin, according to UEFA and Wikipedia. The expansion roughly doubled the volume of public match data available each autumn and winter. The top eight clubs advance directly to the round of 16, while those ranked ninth to twenty-fourth enter a knockout playoff round to claim the remaining places.
Which stats best predict match outcomes?
Over a run of games, expected goals for and against tend to predict future results better than raw shots, possession or even recent wins and losses, because xG captures chance quality and is more stable across samples. Analysts often use rolling xG over the last several matches, adjust for game state and strip out penalties to isolate open-play performance. No metric forecasts a single match reliably, since football is low-scoring and variance is high. The practical lesson is to weight repeatable underlying numbers over one dramatic result, and to combine the data with context such as injuries, fixture congestion and what each team needs from the game.
Are advanced football stats reliable enough to trust?
They are reliable when used correctly and misleading when over-read. Event data from established suppliers is collected to consistent standards and verified, so the inputs are sound. The limitation lies in interpretation: a single match is a small sample, models differ between providers, and numbers like possession can mislead without context. Treat advanced stats as structured evidence that supports what you saw, not as a verdict that overrides it. Used across many matches, with penalties and game state taken into account, metrics such as xG give a far clearer picture of team quality than the traditional counting stats shown on most broadcast graphics.
Sources
- UEFA.com, official Champions League match statistics and records – https://www.uefa.com/uefachampionsleague/
- Wikipedia, 2024–25 UEFA Champions League – https://en.wikipedia.org/wiki/2024%E2%80%9325_UEFA_Champions_League
- BBC Sport, football coverage and final report – https://www.bbc.com/sport/football
- The Guardian, football analysis and expected-goals explainers – https://www.theguardian.com/football
- Reuters, soccer news and rule-change coverage – https://www.reuters.com/sports/soccer/
Cricket Match Scorecards: Test, ODI & T20 Results Database