Summary
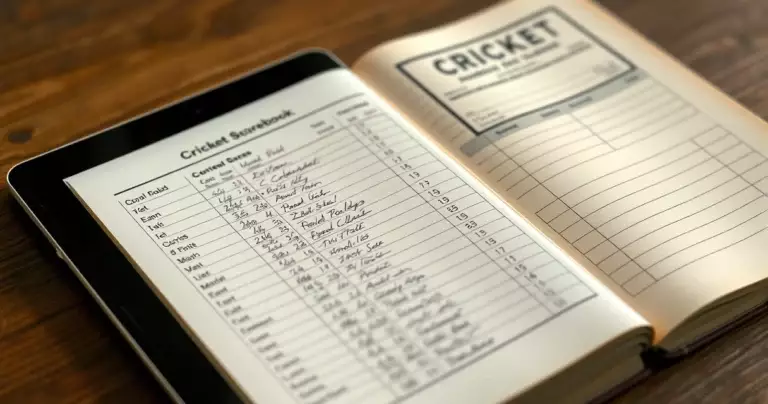
✓Reviewed by Laura BennettA single scorecard line, 8 to 2 to 23 to 4, tells an entire story: eight overs, two maidens, 23 runs conceded, four wickets. Understanding cricket bowling figures explained through this lens is the first step toward...
Table of contents
- 1 Cricket Bowling Figures Explained: The Basic Notation
- 2 How Economy Rate and Strike Rate Are Calculated
- 3 A Short History of Record Bowling Performances
- 4 Why Format Changes the Best Bowling Figures Ranking
- 5 Ranking Best Analysis Performances: A Practical Method
- 6 Table: Benchmark Bowling Figures by Format
- 7 Recent Form: Why Early Breakthroughs Still Shape Figures
- 8 Limitations of Cross-Era and Cross-Format Comparisons
- 9 Frequently Asked Questions
- 9.1 What do cricket bowling figures mean?
- 9.2 What is considered a good bowling figure?
- 9.3 What is a maiden over?
- 9.4 Is 5 wickets for 50 runs better than 4 for 20?
- 9.5 Why are Test and T20 bowling figures hard to compare directly?
- 9.6 Do no-balls affect a bowler’s figures?
- 10 Key Takeaways
- 11 Sources
A single scorecard line, 8 to 2 to 23 to 4, tells an entire story: eight overs, two maidens, 23 runs conceded, four wickets. Understanding cricket bowling figures explained through this lens is the first step toward ranking the best analysis performances in the sport, because a raw wicket count alone can mislead. This guide breaks down the notation, the formulas behind economy rate and strike rate, and how analysts actually rank legendary spells against each other.
Cricket Bowling Figures Explained: The Basic Notation
Every bowling figure follows the same shorthand: overs, maidens, runs conceded, wickets. A line reading 10-2-31-4 means ten overs bowled, two of them maidens, 31 runs conceded and four wickets taken. ESPNcricinfo’s records database, which hosts separate tables for Tests, ODIs, T20Is and first-class cricket, describes best bowling figures in an innings as the most statistically impressive single performance, generally balancing wickets taken against runs conceded.
One quirk trips up newer fans: overs use base-six notation, not decimals. A figure of 22.2 overs means 22 complete overs plus two legal balls of the 23rd, not 22.2 decimal overs. Getting this conversion wrong distorts every rate calculated from it, including economy and strike rate.
How Economy Rate and Strike Rate Are Calculated
Economy rate measures how many runs a bowler concedes per over and is calculated as runs conceded divided by overs bowled. A bowler who concedes 40 runs across ten overs returns an economy rate of exactly 4.00. Strike rate instead measures balls bowled per wicket, calculated as legal deliveries divided by wickets taken, with a lower number indicating more frequent wicket-taking.
A Short History of Record Bowling Performances
Some of the figures still referenced in modern best analysis performances ranked debates date back more than a century. ESPNcricinfo’s Test match records list an Australian bowling performance against England at The Oval in 1882 returning 14 wickets for 90 runs across 33 maidens, alongside the Lord’s 1972 match figures of 16 for 137. Jim Laker’s 10 wickets for 53 runs in a single innings against Australia at Old Trafford in 1956 remains one of the most cited Test landmarks. In limited-overs cricket, Chaminda Vaas took 8 wickets for 19 runs against Zimbabwe in a 2001 ODI, while Rashid Khan returned 6 wickets for 9 runs against Ireland in a 2018 T20 international, figures widely used as format benchmarks.
A four-over spell of 4 for 15 can carry more tactical weight in a T20 than a similar-looking figure spread across a full day of Test cricket.
Why Format Changes the Best Bowling Figures Ranking
Comparing bowling figures across formats without adjustment is one of the most common analytical mistakes. A Test bowler may send down dozens of overs across several days, while a T20 bowler is capped at four. ESPNcricinfo’s ground-specific tables, covering Tests, ODIs, T20Is and first-class matches separately, exist precisely because workload and scoring environment differ so sharply between formats. Fans who want a deeper look at how scorecards translate into historic rankings may enjoy the Best Cricket Scorecard Moments in Test Match History Ranked, which covers a related but distinct angle on all-time performances.
Ranking Best Analysis Performances: A Practical Method
A defensible ranking does not sort every performance by wickets alone. Drawing on how ESPNcricinfo structures its record pages, a sound method ranks wickets first within the same format, then uses runs conceded as the principal tie-breaker, followed by economy rate for control and strike rate for wicket frequency. Context matters too: pitch conditions, opposition strength, match phase and whether a bowler operated in a powerplay or at the death can all shift how a figure should be read.
- Rank wickets first within the same match and format.
- Use runs conceded as the principal tie-breaker.
- Compare economy rate for control.
- Compare strike rate for wicket frequency.
- Adjust for pitch, weather, opposition and match phase.
Table: Benchmark Bowling Figures by Format
| Format | Figures | Bowler / Team | Source |
|---|---|---|---|
| Test (innings) | 10/53 | Jim Laker, Old Trafford 1956 | ESPNcricinfo |
| Test (match) | 16/137 | Australia v England, Lord’s 1972 | ESPNcricinfo |
| ODI (innings) | 8/19 | Chaminda Vaas v Zimbabwe, 2001 | ESPNcricinfo |
| T20I (innings) | 6/9 | Rashid Khan v Ireland, 2018 | ESPNcricinfo |
Recent Form: Why Early Breakthroughs Still Shape Figures
Current match reporting shows why final figures only tell part of the story. Reuters reported that Australia’s Scott Boland took two wickets in as many balls on a rain-affected first day of the second Test against South Africa at St George’s Park, leaving South Africa 20 for 2 at the close of play on 18 October 2026. A spell like that can look modest in the final scorecard line while having already shifted the entire match situation. For readers following the broader Test picture, the ICC World Test Championship Standings piece tracks how individual bowling spells feed into results and points.
Limitations of Cross-Era and Cross-Format Comparisons
Ground and era comparisons require caution. Pitch preparation, boundary dimensions, fielding restrictions, ball technology and playing regulations have all changed over the decades covered by ESPNcricinfo’s record tables, so a 19th-century match figure and a modern T20 figure cannot be read on the same scale without acknowledging those shifts. This article focuses on explaining notation and ranking method rather than attempting a single unified all-time list across every format and era, which the available records themselves avoid doing.
Readers comparing bowling discipline against other bat-and-ball sports may also find the Cricket vs Baseball: Which Sport Is Harder to Bat In? piece a useful companion, while those still untangling run-rate maths alongside bowling figures can check Cricket Run Rate Calculation Mistakes Fans Get Wrong.
Frequently Asked Questions
What do cricket bowling figures mean?
They appear in the order overs, maidens, runs conceded, wickets. A line such as 8-1-24-3 means eight overs bowled, one maiden, 24 runs conceded and three wickets taken.
What is considered a good bowling figure?
It depends heavily on format and conditions. In T20 cricket a figure like 4-0-20-2 is often considered strong, while in a low-scoring Test even 20-8-30-2 can be an excellent, economical spell despite fewer wickets.
What is a maiden over?
A maiden over is one in which the bowler concedes no runs credited to the batter or to extras. Wickets can still fall during a maiden over.
Is 5 wickets for 50 runs better than 4 for 20?
Not automatically. The answer depends on match context, which batters were dismissed, scoring conditions at the time and whether either spell changed the outcome of the match.
Why are Test and T20 bowling figures hard to compare directly?
A Test bowler can bowl dozens of overs across several days, while a T20 bowler is normally limited to four overs in the entire innings, so the statistical opportunity and tactical role are fundamentally different.
Do no-balls affect a bowler’s figures?
Yes. No-balls increase runs conceded, grant the batting side a free hit in several formats and can prevent a wicket from counting, so they are factored into any complete assessment of a bowling performance.
Key Takeaways
Cricket bowling figures explained properly go well beyond the wicket column. The overs-maidens-runs-wickets notation, paired with economy rate and strike rate, gives a fuller picture of control versus wicket-taking threat. When it comes to best analysis performances ranked across history, landmark figures such as Jim Laker’s 10 for 53, Chaminda Vaas’s 8 for 19 and Rashid Khan’s 6 for 9 remain format benchmarks precisely because they combine wickets with tight economy, and current matches like Scott Boland’s double-wicket burst in October 2026 show the same principles still shaping outcomes today.
Sources
- Boland strikes twice on rain-hit first day — Reuters — retrieved October 19, 2026
- Australia Test matches bowling best figures match — ESPNcricinfo — retrieved October 19, 2026
- Old Trafford T20 bowling best career economy rate — ESPNcricinfo — retrieved October 19, 2026
- Adelaide Oval T20I bowling best figures innings — ESPNcricinfo — retrieved October 19, 2026
- M.Chinnaswamy Stadium, Bengaluru bowling best figures innings — ESPNcricinfo — retrieved October 19, 2026
- Multan Cricket Stadium ODI bowling best figures innings — ESPNcricinfo — retrieved October 19, 2026