Summary
Bill Ferguson, the Australian scorer who followed touring teams around the world, recorded the details of 208 Test matches between 1905 and 1957 by hand, often working alone in a press box with little more than a ruled ledger and...
Table of contents
- 1 From Notched Sticks to the First Printed Cards
- 2 The Standardised Scorecard Takes Shape
- 3 The Scorers Who Built the System
- 4 A Timeline of Scorecard Milestones
- 5 The Anatomy of a Modern Scorecard
- 6 The Digital Revolution: Cricinfo, Apps and Live Data
- 7 Ball Tracking, Analytics and the Data-Rich Scorecard
- 8 What the Future Holds for Cricket Scorecards
- 9 Frequently Asked Questions
- 9.1 When were the first cricket scorecards created?
- 9.2 Who was Bill Ferguson and why does he matter?
- 9.3 How did Wisden influence the scorecard format?
- 9.4 When did cricket scorecards move online?
- 9.5 How has ball-tracking technology changed the scorecard?
- 9.6 What is the Duckworth-Lewis-Stern method on a scorecard?
- 9.7 Are human scorers still needed in 2026?
- 9.8 Why do scorecards differ between Test, ODI and T20 cricket?
- 10 Related Reading
- 11 Sources
Bill Ferguson, the Australian scorer who followed touring teams around the world, recorded the details of 208 Test matches between 1905 and 1957 by hand, often working alone in a press box with little more than a ruled ledger and a sharp pencil, according to ESPNcricinfo’s biographical archive. That single career spans the moment cricket scoring grew from a craft practised by a handful of dedicated individuals into a structured discipline, and it sits roughly halfway along a journey that began with notches cut into wooden sticks and now ends with ball-tracking sensors feeding live data to millions of phones. The cricket scorecard, the humble grid of names, numbers and dismissals, has quietly become one of the richest documents in all of sport.
This article traces how that document changed across roughly two and a half centuries: from tally sticks and the first printed cards sold at country grounds, through the standardised columns codified in Victorian England, to the searchable databases and analytics dashboards that define how supporters consume the game in 2026. Along the way it explains who built the conventions still used today, what a modern scorecard actually captures, and where the format is heading next.
From Notched Sticks to the First Printed Cards
Long before anyone printed a grid of batting figures, scoring a cricket match meant cutting marks into wood. Early scorers, sometimes called notchers, sat at the boundary edge and carved a notch into a tally stick for every run completed, with a deeper cut to mark each twentieth. The method was simple, durable and easy to read at a glance, but it captured almost nothing beyond the total. Who scored the runs, how a batter was dismissed and which bowler was responsible all lived in memory rather than on the record.
The shift toward written and printed records began in the eighteenth century. The earliest known printed cricket scorecards are generally attributed to T. Pratt, a scorer based at the Vine ground in Sevenoaks, Kent, who is documented as producing cards from around 1776, as noted in cricket historical references collected on Wikipedia’s entry on the cricket scorecard. These early cards were sold to spectators as souvenirs and aids, listing the players and, in time, their scores. The innovation mattered because it turned a private tally into a public artefact that could be carried home, compared and kept.
Paper scoring did not immediately replace the tally stick. For decades the two coexisted, with notched sticks used to confirm totals while written books recorded a growing amount of detail. As the game spread across England and then to the colonies, the demand for accurate, repeatable records grew, and the loose conventions of individual scorers slowly hardened into shared practice.
The Standardised Scorecard Takes Shape
Two institutions did more than any others to formalise the record. The Marylebone Cricket Club, founded in 1787 and based at Lord’s, became the custodian of the Laws of cricket, as documented by Lord’s and the MCC. As the Laws fixed how runs, wickets and extras were defined, scorers gained a stable vocabulary to record. A run meant the same thing in Kent as it did in Sydney, and a scorecard could therefore be read by anyone who knew the conventions.
The second great force was publication. John Wisden issued the first edition of the Wisden Cricketers’ Almanack in 1864, and the annual became the sport’s reference of record, as set out on Wikipedia’s history of the Almanack. Wisden printed full scorecards for important matches in a consistent layout, and that consistency pushed clubs and newspapers toward the same format. Once readers expected to see batting figures, bowling analyses and a fall-of-wickets line presented a certain way, scorers had a powerful incentive to deliver exactly that.
The first Test match, played between Australia and England at the Melbourne Cricket Ground in March 1877, gave the standardised scorecard its grandest stage, a point confirmed across the ICC’s history of the game. International fixtures demanded records that both nations could trust, and the columns that emerged then are still recognisable in any modern card: each batter’s runs, the bowler and fielder involved in the dismissal, balls faced, and the bowler’s overs, maidens, runs and wickets. Readers who want to decode each of those columns in detail can follow our guide on how to read cricket scorecards.
Standardisation also produced a shared shorthand. The compact abbreviations that fill a scorecard, from c and b for caught and bowled to lbw, st, run out and not out, let scorers pack a full account of a dismissal into a few characters. Those symbols travelled with the game and remain remarkably stable today, as covered in our reference on cricket scorecard symbols and abbreviations.
The Scorers Who Built the System
Behind every elegant printed card stood a person doing meticulous, repetitive work. The most celebrated of them was William Henry “Bill” Ferguson, who lived from 1880 to 1957 and worked as a touring scorer and baggage manager for teams from Australia, England, the West Indies, India and South Africa. ESPNcricinfo records that Ferguson scored 208 Test matches across a career running from 1905 to 1957, a workload that took him across the cricketing world many times over and made him the most travelled scorer of his era.
Ferguson’s lasting contribution was visual. He refined and popularised the wagon wheel, a circular chart drawn around a diagram of the field that plots the direction and value of every scoring shot a batter plays. The idea let a captain or selector see at a glance whether a player scored square, straight or behind the wicket, turning a column of numbers into a picture of method. Modern broadcast graphics and analytics apps still render the same wagon wheel, now generated automatically from logged coordinates rather than inked by hand.
Alongside the wagon wheel came the linear, or ball-by-ball, scoring system, sometimes called the box system. Where a simple tally recorded only totals, linear scoring devotes a cell to every delivery, capturing the bowler, the batter on strike, runs scored and the manner of any dismissal. Two scorers often work in tandem, one keeping the traditional book and the other the linear record, so that each can cross-check the other. The redundancy matters because a single missed entry can throw out an over count or a bowler’s analysis, a class of mistake examined in our piece on common cricket scoring errors.
By the middle of the twentieth century the scorecard had therefore stabilised into a layered document. The summary card gave the public a clean overview, the linear book preserved the full sequence of play, and supplementary charts such as the wagon wheel translated raw figures into tactical insight. Everything that followed in the digital era was, in a sense, an attempt to do all three at once and to do them in real time.
A Timeline of Scorecard Milestones
The table below condenses the major turning points described above and the ones that follow, drawing on the dates published by the sources listed at the end of this article.
| Approximate date | Development | Why it mattered | Source |
|---|---|---|---|
| Pre-1700s | Notched tally sticks | Recorded run totals only, no individual detail | Wikipedia |
| c. 1776 | First printed scorecards (Pratt of Sevenoaks) | Turned scoring into a public, portable record | Wikipedia |
| 1787 | MCC founded at Lord’s | Fixed the Laws and a shared scoring vocabulary | Lord’s / MCC |
| 1864 | First Wisden Almanack | Standardised the printed scorecard layout | Wikipedia |
| 1877 | First Test match, Melbourne | Gave the formal scorecard an international stage | ICC |
| 1905–1957 | Bill Ferguson scores 208 Tests | Popularised the wagon wheel and touring scorer role | ESPNcricinfo |
| 1993 | Cricinfo launches online | Brought ball-by-ball scorecards to the internet | ESPNcricinfo |
| 2001 | Hawk-Eye ball tracking on broadcasts | Added spatial data to the scoring record | Wikipedia |
| 2009 | Decision Review System formally launched | Linked technology directly to scorecard outcomes | ICC |
The Anatomy of a Modern Scorecard
A scorecard today still rests on the columns set down in the Victorian era, but it carries far more information per line. The batting section lists each player, the mode of dismissal, runs scored, balls faced, and in limited-overs cricket the number of fours and sixes plus a strike rate. The bowling section reports overs, maidens, runs conceded, wickets taken and an economy rate, with wides and no-balls often broken out separately. Beneath both sit the extras line, the fall-of-wickets sequence and a result summary.
What a card emphasises now depends heavily on the format. A five-day Test scorecard foregrounds endurance and accumulation, so balls faced and bowling spells carry weight. A Twenty20 card foregrounds tempo, so strike rate, boundary count and economy rate dominate. The structural differences between these formats, and how each card is laid out, are compared in our breakdown of Test, ODI and T20 scorecard differences.
Limited-overs cricket also forced the scorecard to absorb mathematics it never previously needed. The Duckworth-Lewis method, introduced in 1997 and adopted by the ICC for international matches in 1999, gave rain-affected games a fair revised target, and it became the Duckworth-Lewis-Stern method in 2014 after a statistical update, as recorded on Wikipedia’s account of the method. A modern interrupted-match scorecard therefore displays a par score and a revised target that simply could not have existed on a printed Victorian card.
The arrival of Twenty20 cricket from 2003, with the first men’s Twenty20 International played in 2005 and the first global tournament staged in 2007 according to the ICC, accelerated this trend toward density. Shorter games squeeze more meaning into every ball, so each delivery now generates several data points rather than one. The scorecard quietly expanded to hold them.
The Digital Revolution: Cricinfo, Apps and Live Data
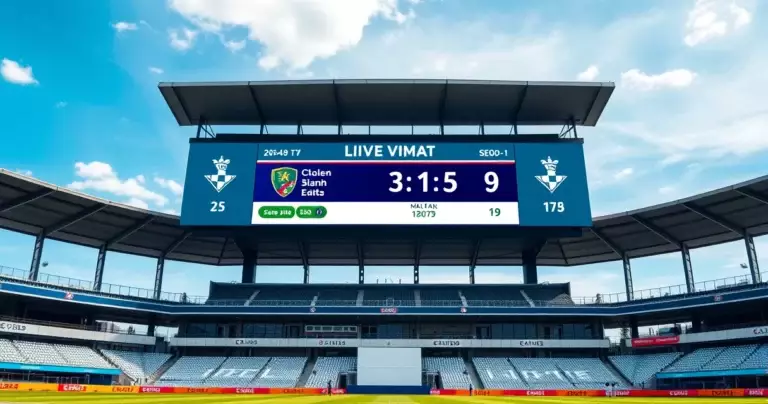
The single largest break in the scorecard’s history was its move off paper. Cricinfo began in 1993 as a volunteer-run service that relayed match information over early internet channels, and it grew into the dominant cricket website before being acquired and rebranded as ESPNcricinfo in 2007, a lineage documented on Wikipedia’s page on ESPNcricinfo. For the first time, a follower anywhere in the world could refresh a page and see a scorecard update ball by ball, without waiting for a newspaper or a radio bulletin.
Two capabilities defined this new era. The first was the live scorecard, a page that refreshes as scorers enter each delivery, often within seconds of the action. The pipeline that carries a ball from the ground to a phone screen, and the reasons it sometimes lags, are explained in our article on live cricket scorecard updates. The second was the searchable archive. Statistical engines such as ESPNcricinfo’s Statsguru turned decades of accumulated scorecards into a queryable database, so a question like a player’s average against a particular country could be answered instantly rather than by leafing through volumes of Wisden.
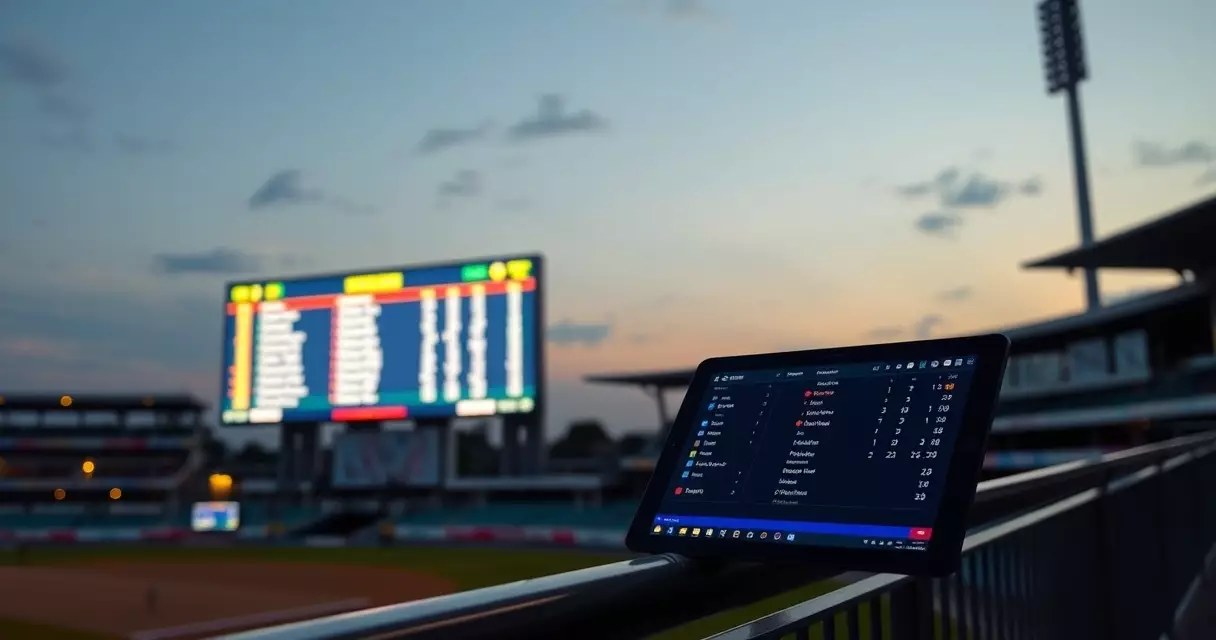
Mobile applications then put that power in every pocket. Competing apps and websites now offer push notifications, animated wagon wheels, partnership graphs and head-to-head records built directly from live scorecard feeds, and they vary widely in speed and depth, as our review of the best cricket scorecard apps and websites sets out. The card stopped being a static printout and became an interactive surface that a user could expand, filter and replay.
| Feature | Paper era scorecard | Digital era scorecard (2026) |
|---|---|---|
| Update speed | End of innings or next-day print | Live, often within seconds of each ball |
| Data per delivery | Runs and dismissals only | Speed, line, length, shot type, fielding position |
| Access | Ground attendees and newspaper readers | Global, on phones, tablets and televisions |
| Search and history | Manual lookup in printed almanacks | Instant queries via databases such as Statsguru |
| Visual aids | Hand-drawn wagon wheel | Auto-generated charts, maps and projections |
Ball Tracking, Analytics and the Data-Rich Scorecard
Digital delivery solved distribution, but a second wave of technology changed what could be recorded in the first place. Hawk-Eye, the camera-based ball-tracking system, was introduced to cricket broadcasts in 2001 and reconstructed the three-dimensional path of every delivery, as described on Wikipedia’s entry on Hawk-Eye. Suddenly a scorecard could be backed by data on a ball’s speed, bounce, swing and projected path, information no human scorer could ever capture by eye.
This spatial data soon became part of officiating. The Decision Review System, trialled from 2008 and formally launched by the ICC in 2009, lets players challenge on-field decisions using ball tracking, edge detection and slow-motion replay, per the ICC’s playing conditions. Because a successful review can overturn a dismissal, the technology now feeds the scorecard directly: a wicket can appear, vanish or change form depending on what the cameras show.
Analytics firms layered interpretation on top of the raw feeds. Platforms that model expected runs, pressure and matchups turned the scorecard from a record of what happened into a tool for predicting what might. Supporters who want to move from reading a card to interrogating it can follow our guide on how to analyse cricket statistics from scorecards, while those weighing match outcomes can see how the same numbers inform match analysis and predictions. The throughline is that every modern insight still traces back to the same columns Ferguson once filled by hand.
What the Future Holds for Cricket Scorecards
As of mid-2026, the clearest trend is personalisation. Rather than serving every viewer the same grid, platforms increasingly tailor the card to the user, surfacing a favourite player’s wagon wheel first or highlighting the matchup a follower cares about. The underlying scorecard remains constant, but the way it is presented adapts to the person reading it.
Automation is the second major direction. Optical and sensor systems can now log many deliveries with minimal human input, and machine-generated summaries can draft a match report straight from the card. Human scorers have not disappeared, because judgment calls and error correction still need a trained eye, yet much of the routine entry once done by hand is shifting to software. The result is faster, denser records that arrive with fewer delays.
A third theme is integration. Scorecards, video clips, tracking data and predictive models are converging into single interfaces where a tap on a wicket plays the replay, shows the ball-tracking and updates the projected total all at once. The flat card is becoming a gateway to a connected record of the match. Whatever shape that takes, the destination remains what Pratt’s first printed cards offered in 1776: a clear, shareable account of who did what, only now measured in milliseconds and gigabytes rather than notches on a stick.
Frequently Asked Questions
When were the first cricket scorecards created?
Before printed cards existed, scorers cut notches into wooden tally sticks to track run totals, a method that recorded little beyond the final score. The earliest known printed cricket scorecards are generally attributed to T. Pratt, a scorer at the Vine ground in Sevenoaks, Kent, who produced cards from around 1776, according to cricket historical references collected on Wikipedia. These early cards were sold to spectators and listed the players and their scores. They marked the moment scoring shifted from a private tally into a public, portable record that supporters could keep, compare and pass on to others.
Who was Bill Ferguson and why does he matter?
William Henry “Bill” Ferguson, who lived from 1880 to 1957, was an Australian touring scorer and baggage manager who worked for teams from several nations. ESPNcricinfo records that he scored 208 Test matches across a career running from 1905 to 1957, making him the most travelled scorer of his time. His lasting legacy is the wagon wheel, a circular chart that plots the direction and value of every scoring shot a batter plays. The same diagram now appears in broadcast graphics and apps, generated automatically from logged coordinates rather than drawn by hand as Ferguson once did.
How did Wisden influence the scorecard format?
John Wisden published the first Wisden Cricketers’ Almanack in 1864, and the annual became cricket’s reference of record, as documented on Wikipedia. Wisden printed full scorecards for major matches in a consistent layout year after year, and that consistency pushed clubs and newspapers to adopt the same structure. Once readers expected batting figures, bowling analyses and a fall-of-wickets line in a familiar arrangement, scorers had strong reason to deliver exactly that. The columns standardised through this period, including runs, balls faced, and bowling overs, maidens, runs and wickets, remain recognisable in any scorecard published today.
When did cricket scorecards move online?
The decisive move off paper came with Cricinfo, which began in 1993 as a volunteer-run internet service relaying match information, according to Wikipedia. It grew into the leading cricket website and was rebranded as ESPNcricinfo in 2007 after being acquired. For the first time, followers anywhere could refresh a page and watch a scorecard update ball by ball without waiting for print or radio. Statistical engines such as Statsguru then turned decades of stored scorecards into a searchable database, allowing instant answers to questions that once required leafing through printed almanacks volume by volume across many seasons.
How has ball-tracking technology changed the scorecard?
Hawk-Eye, the camera-based ball-tracking system, was introduced to cricket broadcasts in 2001 and reconstructs the three-dimensional path of every delivery, as described on Wikipedia. This added data on speed, bounce, swing and projected path that no human scorer could capture by eye. The technology also entered officiating through the Decision Review System, which the ICC formally launched in 2009. Because a successful review can overturn a dismissal, ball tracking now feeds the scorecard directly, meaning a wicket can appear, disappear or change its recorded form depending on what the cameras and edge sensors reveal on review.
What is the Duckworth-Lewis-Stern method on a scorecard?
The Duckworth-Lewis method is a mathematical formula that sets a fair revised target when rain or another interruption shortens a limited-overs match. It was introduced in 1997 and adopted by the ICC for international cricket in 1999, then updated and renamed the Duckworth-Lewis-Stern method in 2014, according to Wikipedia. On a modern interrupted-match scorecard it appears as a par score and a revised target, figures that simply could not exist on a printed Victorian card. The method is one of several elements that expanded the scorecard to hold calculations the format never originally needed to display.
Are human scorers still needed in 2026?
Automation has taken over much of the routine data entry, with optical and sensor systems logging many deliveries and software drafting summaries straight from the card. Even so, human scorers remain part of the process. Judgment calls, unusual dismissals, error correction and reconciling competing records still require a trained eye, and official scorers continue to keep authoritative books alongside automated feeds. The trend is best described as a partnership rather than a replacement: machines handle volume and speed, while people handle accuracy and the awkward cases that algorithms still struggle to interpret correctly on their own.
Why do scorecards differ between Test, ODI and T20 cricket?
Each format prioritises different aspects of play, so its scorecard emphasises different figures. A five-day Test rewards endurance, so balls faced and long bowling spells carry weight. A Twenty20 match rewards tempo, so strike rate, boundary count and economy rate dominate the display. One-day Internationals sit between the two and add a required run rate as a chase develops. The core columns stay the same across all three, but their relative prominence shifts to match the rhythm of the contest, which is why the same player can look very different on two cards from two formats.
Related Reading
- Cricket Match Scorecards: Test, ODI & T20 Results Database (main pillar)
- Best Cricket Scorecard Apps and Websites Compared
- Common Cricket Scoring Errors and How to Avoid Them
- Cricket Scorecard Symbols and Abbreviations Explained
- Cricket Scorecards for Match Analysis and Predictions
- How to Analyze Cricket Statistics from Scorecards
- How to Read Cricket Scorecards: Complete Guide for Beginners
- Live Cricket Scorecard Updates: How They Work
- Test Match vs ODI vs T20 Scorecard Differences
Sources
- Cricket scorecard, history and early printed cards – https://en.wikipedia.org/wiki/Cricket_scorecard
- Wisden Cricketers’ Almanack – https://en.wikipedia.org/wiki/Wisden_Cricketers%27_Almanack
- ESPNcricinfo, history and statistical archive – https://en.wikipedia.org/wiki/ESPNcricinfo
- Hawk-Eye ball-tracking technology – https://en.wikipedia.org/wiki/Hawk-Eye
- Duckworth-Lewis-Stern method – https://en.wikipedia.org/wiki/Duckworth%E2%80%93Lewis%E2%80%93Stern_method
- Lord’s and the MCC, Laws of cricket – https://www.lords.org/mcc/the-laws-of-cricket
- International Cricket Council, history of cricket – https://www.icc-cricket.com/about/cricket/history-of-cricket
- International Cricket Council, playing conditions – https://www.icc-cricket.com/about/cricket/rules-and-regulations/playing-conditions
{“@context”:”https://schema.org”,”@type”:”Article”,”headline”:”Evolution of Cricket Scorecards: From Paper to Digital”,”description”:”How cricket scorecards evolved from notched tally sticks and 1776 printed cards to live digital feeds, ball tracking and analytics in 2026.”,”author”:{“@type”:”Organization”,”name”:”Editorial”},”publisher”:{“@type”:”Organization”,”name”:”Daily Match”},”datePublished”:”2026-06-14″,”dateModified”:”2026-06-14″,”about”:”cricket scorecard history evolution”}