Summary
Every completed cricket scorecard carries hundreds of individual data points, from the run rate recorded at the fall of each wicket to the dot-ball percentage of a single bowling spell. When the International Cricket Council formally adopted the Duckworth-Lewis method...
Table of contents
- 1 What a Cricket Scorecard Reveals to an Analyst
- 2 From Pencil Scorebooks to Prediction Models: A Short History
- 3 The Scorecard Metrics That Actually Move Predictions
- 4 Reading Context: Format, Phase and Conditions
- 5 Building a Prediction Framework from Scorecard Data
- 6 Worked Example: Turning One Scorecard Into a Read
- 7 Variance, Limits and Responsible Analysis
- 8 Frequently Asked Questions
- 8.1 Can a cricket scorecard reliably predict a match result?
- 8.2 Which scorecard metric matters most for limited-overs predictions?
- 8.3 What is a par score and how do I find it?
- 8.4 How does the Duckworth-Lewis-Stern method relate to prediction?
- 8.5 Do different formats need different analytical approaches?
- 8.6 What are the biggest mistakes in scorecard-based prediction?
- 9 Related Reading
- 10 Sources
Every completed cricket scorecard carries hundreds of individual data points, from the run rate recorded at the fall of each wicket to the dot-ball percentage of a single bowling spell. When the International Cricket Council formally adopted the Duckworth-Lewis method for rain-affected limited-overs matches in 1999, it confirmed something dedicated followers already sensed: the figures on a scorecard can be modelled, compared, and used to anticipate what tends to happen next (Wikipedia, Duckworth–Lewis–Stern method). This guide walks through how to read those numbers analytically, how match-prediction thinking grew up alongside the sport, and where the honest limits of any scorecard-based forecast sit.
The framing here is analytical and educational. People who study scorecards include broadcasters, fantasy-league players, coaches, journalists, and bettors, and they all draw on the same public record. Understanding the data does not guarantee a correct prediction, because cricket remains a high-variance game. What good scorecard reading does is replace guesswork with structured reasoning, so a forecast rests on form, conditions, and format rather than reputation alone.
What a Cricket Scorecard Reveals to an Analyst
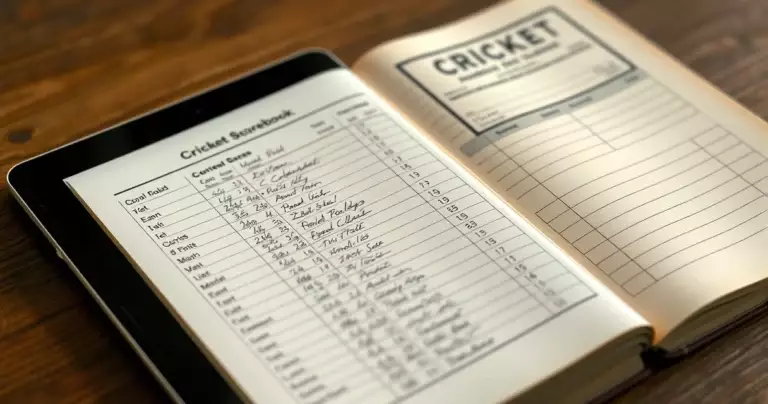
A scorecard is a structured summary of a completed innings or match. At a glance it lists each batter’s runs, balls faced, boundaries, and method of dismissal, alongside every bowler’s overs, maidens, runs conceded, and wickets taken. Beneath that surface sit the derived numbers that analysts care about most: run rate, strike rate, economy rate, partnership values, and the fall-of-wickets sequence that shows exactly when momentum shifted.
Readers who are new to the layout benefit from learning the grammar first. Our walkthrough on how to read cricket scorecards covers the column order and the basic abbreviations, which is worth absorbing before any predictive work. Once the layout feels familiar, the same card stops being a record of the past and starts to read like a set of clues about player form and pitch behaviour.
Three things separate a casual reader from an analyst. The first is context: a score of 250 means very different things on a flat batting surface and a seaming green pitch. The second is comparison: one scorecard tells you little, while a season of them reveals patterns. The third is restraint, because the most useful analysts know which numbers are noise and resist the urge to over-read a single result.

From Pencil Scorebooks to Prediction Models: A Short History
Cricket has kept written records for longer than almost any other team sport. The first official Test match was played between Australia and England in 1877, and the surviving scorecards from that era already recorded runs, dismissals, and bowling figures in a form a modern reader would recognise (Wikipedia, Test cricket). For nearly a century the scorebook was a manual document, kept in pencil by a dedicated scorer sitting near the boundary.
Limited-overs cricket changed the analytical demands. The first One Day International was contested in 1971, compressing a result into a single day and making the run rate a live, decisive number rather than a historical curiosity (Wikipedia, One Day International). Twenty20 went further still after its introduction in England and Wales in 2003, turning every over into a high-stakes data event and rewarding teams that measured boundary frequency and bowling phases precisely (Wikipedia, Twenty20).
Prediction modelling arrived formally through rain. Statisticians Frank Duckworth and Tony Lewis published their resetting method in 1998 in the Journal of the Operational Research Society, providing a mathematical way to set fair revised targets when overs were lost (Journal of the Operational Research Society, 1998). The ICC adopted it in 1999, and after Australian academic Steven Stern revised the model it was renamed the Duckworth-Lewis-Stern method in 2014. That progression matters here, because it proved that the resources a team has left, namely overs and wickets, can be quantified and projected forward.
The Scorecard Metrics That Actually Move Predictions
Not every figure on a card carries equal predictive weight. A handful of metrics do most of the analytical work, and knowing what each one signals keeps a forecast grounded. The reference table below summarises the metrics that matter, what they measure, and the format where they carry the most weight.
| Metric | What it measures | Why it matters for prediction | Most relevant format |
|---|---|---|---|
| Strike rate | Runs scored per 100 balls faced | Signals scoring tempo and a batter’s suitability to the chase | T20 and ODI |
| Economy rate | Runs conceded per over bowled | Identifies bowlers who control the run flow under pressure | T20 and ODI |
| Batting average | Runs per dismissal | Indicates consistency and resistance over time | Test cricket |
| Bowling average | Runs conceded per wicket taken | Measures wicket-taking efficiency across conditions | All formats |
| Dot-ball percentage | Share of balls that yield no run | Builds pressure and forces risky strokes | T20 |
| Partnership value | Runs added between two set batters | Shows where an innings was built or collapsed | All formats |
| Fall of wickets | Score at each dismissal | Maps momentum swings within the innings | All formats |
Strike rate and economy rate sit at the centre of limited-overs analysis because they describe tempo, and tempo decides tight chases. A batter averaging a strike rate near 140 in the powerplay tells a different story from one who accelerates only at the death. Anyone wanting to move from raw figures to genuine interpretation should study our piece on how to analyze cricket statistics from scorecards, which breaks down how these rates interact across an innings.
Averages behave differently. A batting average rewards occupation of the crease and matters most in Test cricket, where survival across sessions shapes results. A low bowling average paired with a low economy rate points to a bowler who both restricts and removes batters, the rarest and most valuable profile. Reading these together, rather than in isolation, is what turns a column of numbers into a usable read.
Reading Context: Format, Phase and Conditions
The same number means different things in different settings, which is why context outranks any single statistic. Format is the first filter. A first-innings total of 160 is a strong score in many T20 matches yet a minor passage of play in a Test. The structural differences between the formats run deep, and our comparison of Test, ODI and T20 scorecard differences lays out how the same metric shifts in meaning from one format to the next.
Phase of play is the second filter. Limited-overs innings break into the powerplay, the middle overs, and the death, and each phase has its own expected scoring band. A side that loses early wickets in the powerplay usually scores more cautiously through the middle, which a fall-of-wickets sequence reveals at a glance. Tracking the phase a team is in helps an analyst judge whether a run rate is sustainable or already stretched.
Conditions form the third filter. Pitch type, ground dimensions, weather, and the toss all shape what a fair score looks like on a given day. The Laws of Cricket, maintained by Marylebone Cricket Club, define the playing conditions that govern these variables, which is why two grounds can produce scores that look incomparable on paper (MCC, the Laws of Cricket). A prediction that ignores conditions is really just a guess wearing a number.
Building a Prediction Framework from Scorecard Data
A workable framework moves in stages, from the broad to the specific. Start with format and venue to establish a par score, the total that history suggests is competitive at that ground. Layer in recent team form drawn from the last several scorecards, then adjust for the specific players available and the conditions on the day. Each stage narrows the range of plausible outcomes without pretending to fix a single answer.
Historical scorecards are the raw material for the par-score step, and a well-organised archive makes the work far faster. A central resource such as our cricket match scorecards database lets an analyst pull venue and head-to-head records quickly, rather than reconstructing them from scattered reports. The steps below outline a repeatable sequence that keeps the process honest.
- Set a par score from venue and format history before looking at the teams.
- Pull each side’s last five to ten scorecards to gauge current form, not reputation.
- Check head-to-head records at the same venue or in similar conditions.
- Adjust for the named playing eleven, injuries, and any returning specialists.
- Weigh the toss and the expected weather, then state a range rather than a point estimate.
Stating a range matters more than it sounds. A forecast such as “first innings likely between 150 and 175” survives contact with reality far better than a single confident figure, because cricket variance is wide. The discipline of expressing uncertainty openly is the difference between analysis and overconfidence.

Worked Example: Turning One Scorecard Into a Read
The illustrative figures below describe a sample ODI first innings, used here purely to demonstrate method rather than to report a real match. The aim is to show how raw card entries convert into the derived reads an analyst would actually use when thinking about the chase to come.
| Scorecard entry (sample) | Raw figure | Derived read | |
|---|---|---|---|
| First-innings total | 248 all out in 49.2 overs | Slightly below a 260 par for the venue, so chase is favoured | |
| Powerplay score | 52 for 1 in 10 overs | Steady, not explosive; pitch rewards patience | |
| Top partnership | 96 for the 3rd wicket | Innings was rebuilt after early loss, not collapse-prone | |
| Death overs (41 to 50) | 61 runs for 4 wickets | Lower-order acceleration was checked by tight bowling | |
| Best bowling figures | 3 for 38 in 10 overs | Economy near 3.8 signals a surface that aids control |
Read together, these entries point toward a chaseable target on a surface that rewards control over raw power. The below-par total, the contained death overs, and the tidy bowling economy all suggest a pitch where wickets in hand will matter more than early aggression. An analyst would then check the chasing side’s recent record at similar totals before settling on a view, and would still frame it as a probability rather than a certainty.
Live scorecards extend this same logic into the second innings, updating the required run rate ball by ball. Understanding how those feeds are compiled, covered in our explainer on live cricket scorecard updates, helps an analyst judge how reliable an in-play number is before acting on it. A read built before play started should be revised, not defended, once real data arrives.
Variance, Limits and Responsible Analysis
Cricket resists prediction by design. A single dropped catch, a sudden rain break, or a collapse of three wickets in an over can overturn the most carefully reasoned forecast. Scorecard analysis improves the quality of a view, yet it cannot remove the randomness that makes the sport compelling. Treating any model output as a guarantee is the most common error a new analyst makes.
Data quality is the second limit. A misrecorded dismissal or a missing extra distorts every derived metric downstream, which is why careful sourcing matters. Familiarity with the kinds of mistakes that creep into records, set out in our guide to common cricket scoring errors, helps an analyst spot a card that should not be trusted. Garbage inputs produce confident nonsense.
Responsible use is the final point. Scorecard analysis is a tool for understanding the game more deeply, and any decision with money or other stakes attached carries real risk that no statistic removes. The ICC publishes player rankings and playing conditions that provide neutral context for serious study (International Cricket Council), and grounding analysis in official sources keeps it honest. The goal of good prediction work is better reasoning, not the illusion of certainty.
Frequently Asked Questions
Can a cricket scorecard reliably predict a match result?
No scorecard predicts a result reliably on its own, because cricket carries high natural variance. What a scorecard does well is narrow the range of likely outcomes by revealing form, tempo, and how a pitch behaved. An analyst who combines several recent cards with venue history, the playing eleven, and conditions can produce a reasoned probability, such as which side is favoured to chase a given total. That reasoning is far stronger than a guess, yet it remains a probability. A single match can always defy the data through a collapse, a dropped catch, or weather, so treating any forecast as a guarantee is a mistake.
Which scorecard metric matters most for limited-overs predictions?
For one-day and Twenty20 cricket, tempo metrics carry the most weight, which means strike rate for batters and economy rate for bowlers. These two figures describe how quickly runs are scored and conceded, and tight chases are usually decided by tempo rather than raw totals. Dot-ball percentage matters greatly in T20, because pressure built through unscored balls forces risky strokes. Strike rate and economy should always be read by phase, since powerplay, middle-over, and death numbers differ sharply. No single metric stands alone; the value comes from reading several together against the format and conditions of the specific match.
What is a par score and how do I find it?
A par score is the total that historically tends to be competitive at a particular venue in a particular format. It serves as a baseline for judging whether a first-innings total is strong, average, or below standard. You find it by pulling the scorecards of past matches at the same ground, ideally in similar conditions and the same format, then looking at the average winning and chasing totals. Organised archives make this far faster than reconstructing records by hand. A par score is a starting reference, not a fixed rule, and it should always be adjusted for the pitch, weather, and teams on the day in question.
How does the Duckworth-Lewis-Stern method relate to prediction?
The Duckworth-Lewis-Stern method is a mathematical model that resets targets in rain-affected limited-overs matches by valuing the resources a team has left, namely overs and wickets remaining. It was first published in 1998, adopted by the ICC in 1999, and revised and renamed after Steven Stern in 2014. Its relevance to prediction is conceptual rather than direct: it proved that a team’s remaining resources can be quantified and projected forward. Analysts borrow that thinking when they assess whether a chasing side is ahead of or behind a required rate. The method itself only governs interrupted matches, but its underlying logic shapes how serious followers reason about run chases.
Do different formats need different analytical approaches?
Yes, each format rewards a different reading of the same metrics. Test cricket places weight on batting averages, occupation of the crease, and bowling averages across long spells, because results unfold over days. One-day cricket balances accumulation with run rate, so partnerships and phase scoring matter. Twenty20 prizes tempo above almost everything, which elevates strike rate, economy rate, and dot-ball percentage. A total that looks dominant in one format can be ordinary in another, so an analyst must filter every number through the format first. Applying T20 tempo expectations to a Test innings, or the reverse, produces misleading reads and weak forecasts.
What are the biggest mistakes in scorecard-based prediction?
The most frequent mistake is over-reading a single scorecard, since one match is mostly noise and patterns only appear across many. A close second is ignoring conditions, because pitch, ground size, weather, and the toss reshape what a fair score looks like. Trusting flawed data is another trap, as a misrecorded dismissal distorts every derived metric. Many analysts also state a single confident figure instead of a range, which hides the real uncertainty in the game. Finally, confusing reputation with current form leads people astray. Disciplined analysts use multiple cards, respect conditions, verify their sources, and always express predictions as probabilities.
Related Reading
- Cricket Match Scorecards: Test, ODI & T20 Results Database (main pillar)
- Best Cricket Scorecard Apps and Websites Compared
- Common Cricket Scoring Errors and How to Avoid Them
- Cricket Scorecard Symbols and Abbreviations Explained
- Evolution of Cricket Scorecards: From Paper to Digital
- How to Analyze Cricket Statistics from Scorecards
- How to Read Cricket Scorecards: Complete Guide for Beginners
- Live Cricket Scorecard Updates: How They Work
- Test Match vs ODI vs T20 Scorecard Differences
Sources
- Wikipedia, Duckworth–Lewis–Stern method – https://en.wikipedia.org/wiki/Duckworth%E2%80%93Lewis%E2%80%93Stern_method
- Wikipedia, Test cricket – https://en.wikipedia.org/wiki/Test_cricket
- Wikipedia, One Day International – https://en.wikipedia.org/wiki/One_Day_International
- Wikipedia, Twenty20 – https://en.wikipedia.org/wiki/Twenty20
- Journal of the Operational Research Society (Taylor & Francis), Duckworth and Lewis 1998 – https://www.tandfonline.com/doi/abs/10.1057/palgrave.jors.2600691
- Marylebone Cricket Club, the Laws of Cricket – https://www.lords.org/mcc/the-laws-of-cricket
- International Cricket Council – https://www.icc-cricket.com
- ESPNcricinfo Statsguru – https://stats.espncricinfo.com
{“@context”:”https://schema.org”,”@type”:”Article”,”headline”:”Cricket Scorecards for Match Analysis and Predictions”,”description”:”How to use cricket scorecard data, metrics, and format context to analyze matches and build grounded, responsible predictions.”,”author”:{“@type”:”Organization”,”name”:”Editorial”},”publisher”:{“@type”:”Organization”,”name”:”Daily Match”},”inLanguage”:”en”}