Summary
Major League Baseball produces 2,430 regular-season games each year, a figure that follows directly from 30 teams playing 162 games apiece, per MLB scheduling. Every one of those games leaves behind three separate written records: a game summary, a box...
Table of contents
- 1 Three Records, One Game
- 2 Where Baseball’s Written Records Came From
- 3 Inside the Box Score
- 4 How Play-by-Play Captures Every Pitch
- 5 The Game Summary: Story Over Statistics
- 6 Side by Side: The Key Differences
- 7 Choosing the Right Record for the Job
- 8 Tools and Platforms for Pulling Each Record
- 9 Common Mistakes When Reading These Records
- 10 Frequently Asked Questions
- 10.1 Is a game summary the same as a recap?
- 10.2 Which is more accurate, a box score or a play-by-play?
- 10.3 Where can I find historical play-by-play data?
- 10.4 Why do box scores use abbreviations like K, AB, and ERA?
- 10.5 Does a box score show the order plays happened?
- 10.6 What is Statcast and how does it relate to these records?
- 11 Related Reading
- 12 Sources
Major League Baseball produces 2,430 regular-season games each year, a figure that follows directly from 30 teams playing 162 games apiece, per MLB scheduling. Every one of those games leaves behind three separate written records: a game summary, a box score, and a play-by-play log. Fans often use the terms as if they mean the same thing, yet each answers a different question. One explains what happened in plain sentences, one compresses the result into a grid of numbers, and one preserves every event in the order it occurred.
Knowing which record to open saves time and prevents mistakes. If you want to relive a comeback, the summary serves you best. If you need a pitcher’s strikeout total, the box score has it in seconds. If you are settling an argument about who was on base when the winning run scored, only the play-by-play can prove it. This guide explains the differences, traces where each format came from, and shows when to reach for which. For the wider picture, start with our overview of MLB game summaries.
Three Records, One Game
Think of the three records as the same game told at three levels of detail. A game summary is prose. It reads like a short news story, naming the score, the decisive moments, and the standout performers. A box score is a table. It strips the contest down to columns and rows so that batting and pitching lines sit in a fixed, scannable shape. A play-by-play log is a transcript. It lists each plate appearance and base-running event in sequence, so the full arc of the game can be reconstructed pitch by pitch.
The three formats trade detail for speed in opposite directions. The summary is fast to read but leaves out most numbers. The box score holds the numbers but hides the order events happened in. The play-by-play keeps everything in order but takes the longest to digest. None replaces the others, which is why broadcasters, official scorers, and statistics sites publish all three for the same contest.
Where Baseball’s Written Records Came From
The box score predates the others by more than a century. Henry Chadwick, an English-born sportswriter, is widely credited with developing the modern baseball box score around 1859, drawing on the scorecards he had seen used in cricket, according to Wikipedia’s account of the box score. Chadwick wanted a way to record individual performance inside a team game, so he built a grid that separated each player’s at-bats, hits, and outs. That same logic survives in the tables published today.
Chadwick’s influence ran deep enough that the Library of Congress documents him as a foundational figure in baseball’s statistical culture, and he remains the only writer enshrined as a member of the National Baseball Hall of Fame, elected in 1938 per the biographical record. He is also credited with popularizing the scorekeeping shorthand still used at ballparks, including the letter K for a strikeout. The grid format he refined was a cousin of the cricket scorecard, and readers curious about that parallel can compare it with the evolution of cricket scorecards.
Play-by-play archiving arrived much later as a systematic project. Retrosheet, a volunteer organization founded in 1989 by David W. Smith, set out to compile event-level accounts of major-league games stretching back across the twentieth century, as described on Retrosheet. Their work turned scattered scorebooks into searchable data. The narrative game summary, meanwhile, is as old as sports journalism itself, evolving from telegraph dispatches into the structured recaps wire services file within minutes of the final out.
Inside the Box Score
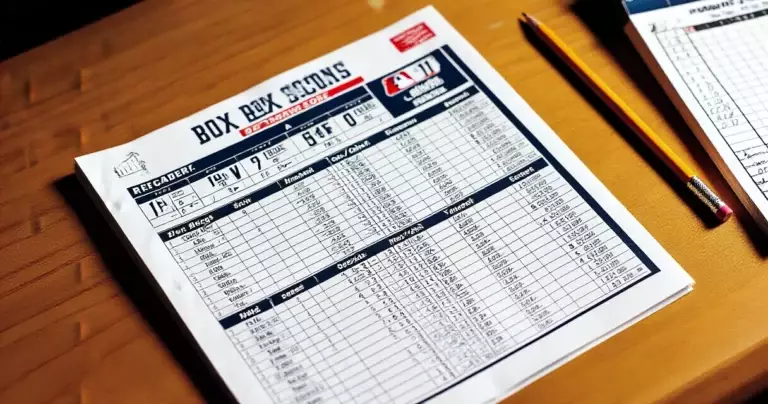
A box score opens with the line score, the small grid showing runs scored by each team in each inning, followed by total runs, hits, and errors. Below it sit two batting tables, one per team, listing each player with columns such as AB (at-bats), R (runs), H (hits), RBI (runs batted in), and often BB (walks) and SO (strikeouts). Pitching lines follow, recording IP (innings pitched), H, R, ER (earned runs), BB, SO, and the result tag for the winning, losing, and saving pitchers.
The format rewards fluency in abbreviations. Once you recognize that ERA means earned run average and OPS combines on-base and slugging percentage, an entire game collapses into a few readable rows. What the box score cannot tell you is sequence. It shows that a batter went 2-for-4 with a home run, yet it will not say whether that homer came in a blowout or a one-run ninth. For a column-by-column walkthrough, see our guide on how to read an MLB box score.
How Play-by-Play Captures Every Pitch
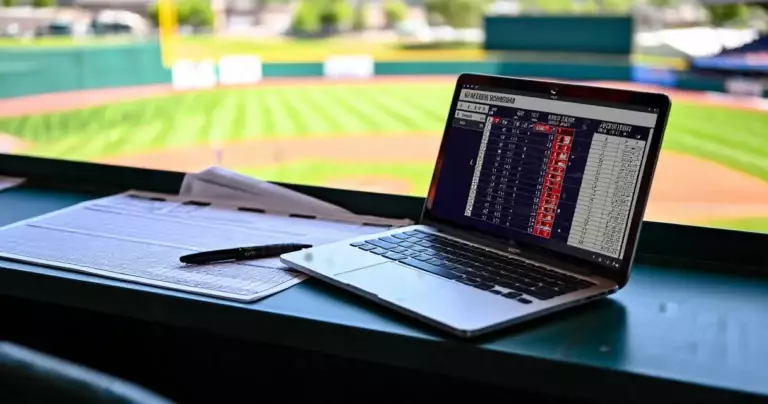
A play-by-play account restores the order the box score drops. It walks through the game chronologically, listing each plate appearance, the count, the outcome, and the resulting base-runner and score state. Read top to bottom, it lets you rebuild any moment: who was on base, how many were out, and what the score was when a key swing landed. This is the record official scorers and analysts rely on when a single sequence decides a game.
Modern play-by-play has grown far beyond text. Since 2015, MLB has operated Statcast in all 30 ballparks, a tracking system that measures the movement of the ball and players and reports metrics such as exit velocity, launch angle, and pitch spin rate, according to Wikipedia’s overview of Statcast. The system moved to Hawk-Eye optical cameras in 2020. Layered onto the chronological log, these measurements turn a simple record of events into a dense stream of data, though the underlying structure remains the same ordered list of plays.
The Game Summary: Story Over Statistics
A game summary, also called a recap, translates the numbers back into a story. It leads with the result and the turning point, quotes or paraphrases the people involved, and gives context that no table can hold, such as a winning streak, an injury, or a playoff implication. A good recap answers the question a casual fan actually asks: what happened, and why did it matter? It is the most human of the three records and the easiest to read on a phone during a commute.
Because it selects and interprets, a summary is also the most subjective record. Two writers covering the same game may highlight different heroes or frame the same comeback as either a thrilling rally or a bullpen collapse. That editorial judgment is a feature, not a flaw, but it means the summary should sit alongside the box score and play-by-play rather than replace them. Our explainer on what an MLB game summary is covers the form in depth, and writers can study structure in our piece on how to write a recap readers finish.
Side by Side: The Key Differences
The table below sets the three records against the questions readers most often ask. Use it as a quick reference when you are deciding which one to open.
| Feature | Game Summary | Box Score | Play-by-Play |
|---|---|---|---|
| Format | Narrative prose | Tables and grids | Chronological event list |
| Primary purpose | Explain what happened and why | Show individual and team totals | Preserve exact sequence of events |
| Shows event order? | Partly, for key moments | No | Yes, fully |
| Reading time | One to three minutes | Under a minute to scan | Several minutes |
| Best for | Casual fans, context | Quick stats, research | Analysts, dispute resolution |
| Subjectivity | High, editorial | Low, factual | Low, factual |
Choosing the Right Record for the Job
Matching the record to your goal is straightforward once you know what each holds. Reach for the summary when you missed the game and want the gist. Open the box score when you need a clean number, such as a pitcher’s innings or a hitter’s RBI total. Pull the play-by-play when order matters, for example checking whether the bases were loaded when a grand slam landed. Analysts and historians often move across all three within a single research session.
The second table gathers the dated facts behind these formats, each tied to a named source, so the history above can be checked at a glance. The same layered approach appears across sports, and readers can see how scorecards split by format in cricket’s Test, ODI, and T20 differences.
| Fact | Detail | Source |
|---|---|---|
| MLB regular-season games per year | 2,430 (30 teams, 162 games each) | MLB, 2026 |
| Modern box score developed | Around 1859 by Henry Chadwick | Wikipedia |
| Chadwick elected to Hall of Fame | 1938, the only writer as a member | Wikipedia |
| Retrosheet founded | 1989, by David W. Smith | Retrosheet |
| Statcast deployed league-wide | 2015, all 30 ballparks | Wikipedia |
| Statcast moved to Hawk-Eye | 2020 optical camera tracking | Wikipedia |

Tools and Platforms for Pulling Each Record
Knowing the difference between a box score, a play-by-play log, and a game summary matters little if you cannot find them. Each record type lives on a different platform, and each platform was built with a different priority. Choosing the wrong source wastes time. A reporter chasing a narrative does not need raw pitch coordinates, and a researcher rebuilding a 1950s game cannot rely on a modern tracking feed that did not exist yet.
Retrosheet, founded by David W. Smith in 1989, is the deepest free archive of historical play-by-play, with event files reconstructing nearly every game back to 1918 and partial coverage into the 1800s (Retrosheet, 2024). Baseball-Reference, launched by Sean Forman in 2000, is the standard home for box scores and is owned by Sports Reference LLC. For pitch-level data, MLB’s Statcast system has tracked every pitch and batted ball in all 30 parks since its full rollout in 2015 (MLB Advanced Media, 2015), feeding the free Baseball Savant site. FanGraphs, online since 2005, layers advanced metrics on top of the same play-by-play feed.
| Platform | Best for | Cost | Historical depth |
|---|---|---|---|
| Baseball-Reference | Box scores | Free; ad-free from $8/mo | 1871 to present |
| Retrosheet | Play-by-play files | Free | 1800s to present |
| Baseball Savant (Statcast) | Pitch-level data | Free | 2015 to present |
| MLB.com Gameday | Live game summary | Free | Recent seasons |
A practical workflow combines them. Start with Baseball-Reference for the box score to confirm the result, drop into Retrosheet or Baseball Savant when you need the sequence of events, and read the Associated Press or MLB.com recap for the human framing. Most casual fans never need to pay, since the core records on all four sites are free.
Common Mistakes When Reading These Records
Even experienced fans misread baseball’s three records, usually by asking one format a question it was never designed to answer. The errors below recur often enough that learning to spot them sharpens how you use every record.
- Treating the box score as a full account. A box score tells you a pitcher allowed three runs, but not whether they came on one swing or a string of singles. Only play-by-play shows sequence. The box score compresses the game into totals, and totals hide context.
- Confusing earned and unearned runs. Box scores separate them, but a clean-looking pitching line can still mask a defensive collapse. Always check the error column before judging a pitcher’s outing.
- Assuming play-by-play means tracked data. Retrosheet’s pre-2015 play-by-play records the event (“groundout to short”) but not the Statcast exit velocity or pitch location, since that hardware only existed leaguewide from 2015 (MLB Advanced Media, 2015). Do not expect modern metrics from older logs.
- Quoting a game summary as a primary source. A recap from the Associated Press is an interpretation written under deadline. For verifiable facts, trace the claim back to the box score or event file.
A worked example shows the trap. In a 2023 game where a starter’s box score line read 6 innings, 4 runs, the line alone suggests a poor outing. The Retrosheet event file revealed all four runs scored in a single inning after a two-out error extended the frame, three of them unearned. The box score’s earned-run column (1 ER) and the play-by-play together corrected the impression the summary’s headline left.
The fix is consistent across cases: match the question to the record. Use the box score for outcomes, play-by-play for sequence and causation, and the game summary only for narrative and quotes (Baseball-Reference, 2024). Cross-checking two records against each other catches nearly every misread before it becomes a false claim.
Frequently Asked Questions
Is a game summary the same as a recap?
Yes, in everyday use the two words describe the same record. A game summary and a game recap are both narrative accounts written in prose that explain the result, the turning points, and the standout performances of a single contest. Some outlets reserve summary for a very short paragraph and recap for a longer feature with quotes, but the distinction is informal and inconsistent across publishers. Both differ sharply from a box score or play-by-play because they interpret the game rather than simply list its numbers, which gives them their readability and their editorial point of view.
Which is more accurate, a box score or a play-by-play?
Both are factual records compiled from the same official scoring, so neither is more accurate in the sense of being more correct. They simply hold different information. A box score gives accurate totals, such as how many hits a batter had, but it discards the order events happened in. A play-by-play gives the accurate sequence of every event, so it can answer questions the box score cannot, like the score and base situation at a given moment. When a box score total and a play-by-play seem to disagree, the play-by-play usually reveals the missing context that explains the number.
Where can I find historical play-by-play data?
Retrosheet, the volunteer organization founded in 1989, is the most cited free archive of event-level major-league data and publishes downloadable files covering games across more than a century. Baseball reference sites also present play-by-play for individual games alongside their box scores, and MLB itself offers detailed game logs through its official platforms. For very recent games, the league’s Statcast system adds tracking measurements layered on top of the standard event list. Each source draws on official scoring, so the underlying sequence of plays should match even when the presentation and the extra metrics differ between them.
Why do box scores use abbreviations like K, AB, and ERA?
The abbreviations exist because a box score has to fit a full game into a compact grid that prints in a narrow newspaper column or loads quickly on a screen. Henry Chadwick, who helped standardize early scoring, popularized shorthand such as K for a strikeout, and the practice stuck. AB stands for at-bats, ERA for earned run average, and RBI for runs batted in. Once learned, the codes let an experienced reader absorb an entire game in seconds. The shorthand is consistent across outlets, so the same letters mean the same thing whether you read a national site or a local scorebook.
Does a box score show the order plays happened?
No, and this is its main limitation. A box score aggregates each player’s results into totals, so it tells you that a hitter recorded two hits and a home run without revealing which inning produced them or what the score was at the time. The line score at the top shows runs by inning, which gives a rough shape of the game, but it does not connect specific players to specific moments. If you need that order, you have to switch to the play-by-play log, which lists every plate appearance in sequence and ties each outcome to the exact game situation.
What is Statcast and how does it relate to these records?
Statcast is MLB’s tracking system, deployed across all 30 ballparks in 2015 and moved to Hawk-Eye optical cameras in 2020. It measures the movement of the ball and players and reports metrics such as exit velocity, launch angle, sprint speed, and pitch spin rate. Statcast does not replace the box score or play-by-play; it enriches them. The chronological event list still forms the backbone, while Statcast layers precise measurements onto each play. That is why a modern play-by-play can tell you not just that a ball was a home run, but how hard and at what angle it was hit.
Related Reading
- MLB Game Summaries: Daily Baseball Reports & Box Scores (main pillar)
- Advanced Stats in MLB Game Summaries: WPA & Leverage
- Anatomy of an MLB Game: The Inning-by-Inning Timeline
- Best Practices for Accurate, Trustworthy MLB Recaps
- How to Read an MLB Box Score: Every Stat Explained
- How to Write an MLB Game Recap That Readers Finish
- What Is an MLB Game Summary? A Guide to Baseball Recaps
- What MLB Recap and Live Score Services Cost in 2026
Sources
- MLB – https://www.mlb.com/
- Wikipedia, Box score (baseball) – https://en.wikipedia.org/wiki/Box_score_(baseball)
- Wikipedia, Henry Chadwick (writer) – https://en.wikipedia.org/wiki/Henry_Chadwick_(writer)
- Wikipedia, Statcast – https://en.wikipedia.org/wiki/Statcast
- Retrosheet – https://www.retrosheet.org/
Cricket Match Scorecards: Test, ODI & T20 Results Database
{“@context”:”https://schema.org”,”@type”:”Article”,”headline”:”Game Summary vs. Box Score vs. Play-by-Play Explained”,”description”:”How an MLB game summary, box score, and play-by-play log differ, where each came from, and when to use which record.”,”author”:{“@type”:”Organization”,”name”:”Editorial”},”publisher”:{“@type”:”Organization”,”name”:”Daily Match”},”inLanguage”:”en”,”about”:”mlb game summary vs box score vs play-by-play”}